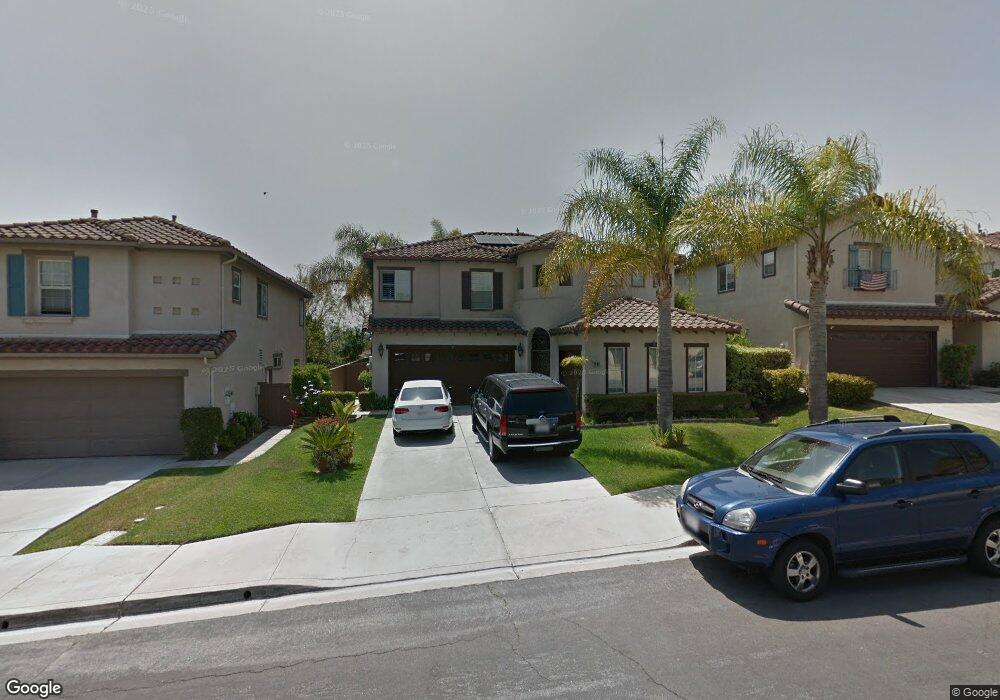
2440 Steamboat Springs Ct Chula Vista, CA 91915
Eastlake NeighborhoodEstimated Value: $988,855 - $1,159,000
4
Beds
3
Baths
2,358
Sq Ft
$457/Sq Ft
Est. Value
About This Home
This home is located at 2440 Steamboat Springs Ct, Chula Vista, CA 91915 and is currently estimated at $1,078,214, approximately $457 per square foot. 2440 Steamboat Springs Ct is a home located in San Diego County with nearby schools including Olympic View Elementary School, Eastlake Middle School, and Eastlake High School.
Ownership History
Date
Name
Owned For
Owner Type
Purchase Details
Closed on
Jan 6, 2020
Sold by
Hernandez Carolinea and Caroline A Hernandez Living Tr
Bought by
Castaneda Paula
Current Estimated Value
Purchase Details
Closed on
Sep 9, 2019
Sold by
Hernandez Caroline
Bought by
Castaneda Paulo
Purchase Details
Closed on
Feb 15, 2019
Sold by
Hernandez Daniel C and Hernandez Caroline A
Bought by
Hernandez Caroline A and Caroline A Hernandez Living Tr
Purchase Details
Closed on
Nov 4, 1998
Sold by
Kaufman & Broad Coastal Inc
Bought by
Hernandez Daniel and Hernandez Caroline
Home Financials for this Owner
Home Financials are based on the most recent Mortgage that was taken out on this home.
Original Mortgage
$184,808
Interest Rate
6.52%
Create a Home Valuation Report for This Property
The Home Valuation Report is an in-depth analysis detailing your home's value as well as a comparison with similar homes in the area
Home Values in the Area
Average Home Value in this Area
Purchase History
| Date | Buyer | Sale Price | Title Company |
|---|---|---|---|
| Castaneda Paula | -- | None Available | |
| Castaneda Paulo | -- | None Available | |
| Hernandez Caroline A | -- | None Available | |
| Hernandez Daniel | $231,500 | First American Title |
Source: Public Records
Mortgage History
| Date | Status | Borrower | Loan Amount |
|---|---|---|---|
| Previous Owner | Hernandez Daniel | $184,808 | |
| Closed | Hernandez Daniel | $11,550 |
Source: Public Records
Tax History Compared to Growth
Tax History
| Year | Tax Paid | Tax Assessment Tax Assessment Total Assessment is a certain percentage of the fair market value that is determined by local assessors to be the total taxable value of land and additions on the property. | Land | Improvement |
|---|---|---|---|---|
| 2025 | $4,132 | $366,430 | $119,133 | $247,297 |
| 2024 | $4,132 | $359,247 | $116,798 | $242,449 |
| 2023 | $5,669 | $352,204 | $114,508 | $237,696 |
| 2022 | $5,493 | $345,299 | $112,263 | $233,036 |
| 2021 | $5,443 | $338,529 | $110,062 | $228,467 |
| 2020 | $5,237 | $335,059 | $108,934 | $226,125 |
| 2019 | $5,105 | $328,491 | $106,799 | $221,692 |
| 2018 | $5,012 | $322,051 | $104,705 | $217,346 |
| 2017 | $12 | $315,737 | $102,652 | $213,085 |
| 2016 | $4,804 | $309,547 | $100,640 | $208,907 |
| 2015 | $4,728 | $304,899 | $99,129 | $205,770 |
| 2014 | $5,263 | $298,928 | $97,188 | $201,740 |
Source: Public Records
Map
Nearby Homes
- 1452 S Creekside Dr
- 2408 Green River Dr
- 1603 Quiet Trail Dr
- 1220 Silverado Dr
- 1215 Pinehurst Rd
- 1277 Granite Springs Dr
- 2088 Bravo Loop
- 2065 Bravo Loop Unit 6
- 2235 Old Barn Ln
- 1572 Hackberry Place
- 1569 Hackberry Place
- 1446 Caminito Sardinia
- 2710 Apricot Ct
- 1246 Boca Raton Dr
- 2721 Castlehill Rd Unit 1
- 1445 Caminito Sicilia
- 1427 Marble Canyon Way
- 2181 Caminito Norina Unit 134
- 1526 Caminito Sicilia
- 2300 Palomira Ct
- 2436 Steamboat Springs Ct
- 2444 Steamboat Springs Ct
- 2432 Steamboat Springs Ct
- 2441 Steamboat Springs Ct
- 2437 Steamboat Springs Ct
- 2445 Steamboat Springs Ct
- 2433 Steamboat Springs Ct
- 2452 Steamboat Springs Ct
- 2449 Steamboat Springs Ct
- 2453 New Seabury Way
- 2449 New Seabury Way
- 2429 Steamboat Springs Ct
- 2424 Steamboat Springs Ct
- 2457 New Seabury Way
- 2453 Steamboat Springs Ct
- 2460 Steamboat Springs Ct
- 2461 New Seabury Way
- 1400 Palm Beach St Unit 12
- 2425 Steamboat Springs Ct
- 2420 Steamboat Springs Ct