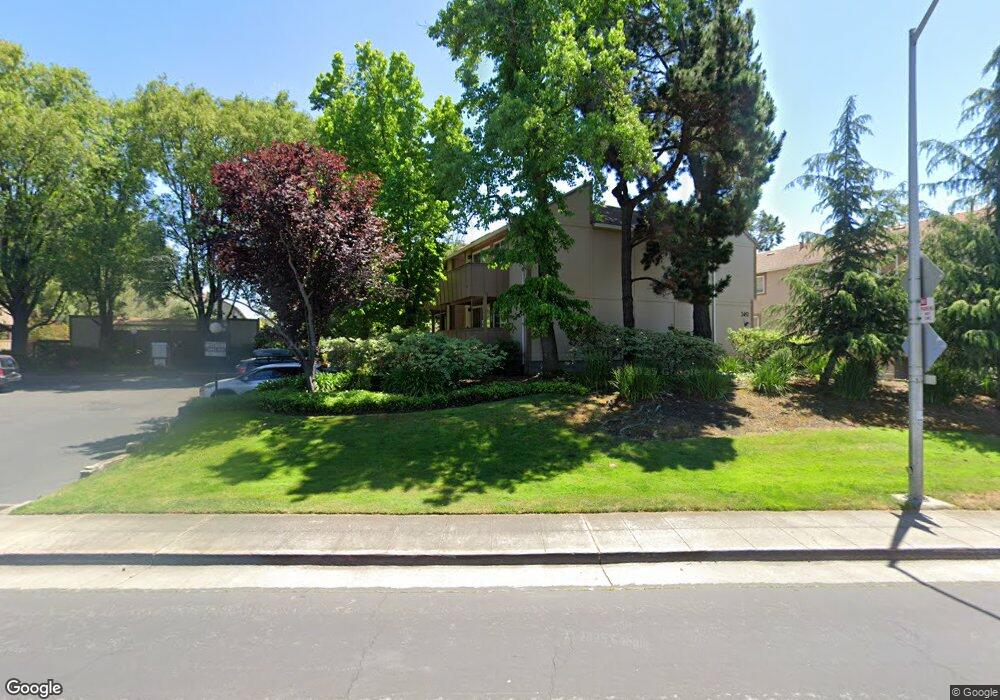
2452 W Bayshore Rd Unit 2 Palo Alto, CA 94303
Midtown Palo Alto NeighborhoodEstimated Value: $931,000 - $1,478,000
3
Beds
2
Baths
1,134
Sq Ft
$978/Sq Ft
Est. Value
About This Home
Non Smoking
Maximum 1 pet allowed. Cats and small dogs allowed. Small dog(s) (Less than 20 lbs). Pet security deposit of $200 and rent of $50/month applies.
Utilities paid by tenant:
Electricity + Gas + Sewer (City of Palo Alto utilities)
TV/Internet
Rent includes HOA fees, water and garbage removal.
Every adult who will live in the home will need to submit an application. Application fee applies.
Ownership History
Date
Name
Owned For
Owner Type
Purchase Details
Closed on
Jun 11, 2013
Sold by
Ning Shoucheng and Zhang Ling Yi
Bought by
Nikumbh Amardeep R and Kajale Kaveree G
Current Estimated Value
Home Financials for this Owner
Home Financials are based on the most recent Mortgage that was taken out on this home.
Original Mortgage
$524,000
Outstanding Balance
$369,907
Interest Rate
3.32%
Mortgage Type
New Conventional
Estimated Equity
$738,794
Purchase Details
Closed on
Jun 26, 1997
Sold by
Uan Mo Ngoc
Bought by
Ning Shoucheng and Zhang Ling Yi
Home Financials for this Owner
Home Financials are based on the most recent Mortgage that was taken out on this home.
Original Mortgage
$152,000
Interest Rate
7.92%
Create a Home Valuation Report for This Property
The Home Valuation Report is an in-depth analysis detailing your home's value as well as a comparison with similar homes in the area
Home Values in the Area
Average Home Value in this Area
Purchase History
| Date | Buyer | Sale Price | Title Company |
|---|---|---|---|
| Nikumbh Amardeep R | $655,500 | Fidelity National Title Co | |
| Ning Shoucheng | $169,000 | Fidelity National Title Co |
Source: Public Records
Mortgage History
| Date | Status | Borrower | Loan Amount |
|---|---|---|---|
| Open | Nikumbh Amardeep R | $524,000 | |
| Previous Owner | Ning Shoucheng | $152,000 |
Source: Public Records
Property History
| Date | Event | Price | List to Sale | Price per Sq Ft |
|---|---|---|---|---|
| 12/03/2024 12/03/24 | Off Market | $4,450 | -- | -- |
| 11/22/2024 11/22/24 | For Rent | $4,450 | 0.0% | -- |
| 11/18/2024 11/18/24 | Off Market | $4,450 | -- | -- |
| 10/08/2024 10/08/24 | Price Changed | $4,450 | -6.3% | $4 / Sq Ft |
| 09/26/2024 09/26/24 | For Rent | $4,750 | -- | -- |
Tax History Compared to Growth
Tax History
| Year | Tax Paid | Tax Assessment Tax Assessment Total Assessment is a certain percentage of the fair market value that is determined by local assessors to be the total taxable value of land and additions on the property. | Land | Improvement |
|---|---|---|---|---|
| 2025 | $10,179 | $806,573 | $403,286 | $403,287 |
| 2024 | $10,179 | $790,759 | $395,379 | $395,380 |
| 2023 | $10,025 | $775,255 | $387,627 | $387,628 |
| 2022 | $9,902 | $760,055 | $380,027 | $380,028 |
| 2021 | $9,706 | $745,153 | $372,576 | $372,577 |
| 2020 | $9,517 | $737,513 | $368,756 | $368,757 |
| 2019 | $9,407 | $723,053 | $361,526 | $361,527 |
| 2018 | $9,162 | $708,877 | $354,438 | $354,439 |
| 2017 | $8,999 | $694,979 | $347,489 | $347,490 |
| 2016 | $8,758 | $681,353 | $340,676 | $340,677 |
| 2015 | $8,667 | $671,119 | $335,559 | $335,560 |
| 2014 | $8,421 | $657,973 | $328,986 | $328,987 |
Source: Public Records
Map
Nearby Homes
- 1037 Amarillo Ave
- 2200 Saint Francis Dr
- 915 Colonial Ln
- Plan 4 at 28FIFTY
- Plan 3 at 28FIFTY
- Plan 1 at 28FIFTY
- Plan 2 at 28FIFTY
- Plan 5 at 28FIFTY
- 2871 Josephine Ln
- 2878 Josephine Ln
- 653 Wildwood Ln
- 1125 Esther Ct
- 1129 Esther Ct
- 161 Primrose Way
- 61 Primrose Way
- 1982 W Bayshore Rd Unit 121
- 836 Warren Way
- 3113 Greer Rd
- 120 Abelia Way
- 3136 Genevieve Ct
- 2452 W Bayshore Rd
- 2452 W Bayshore Rd Unit 10
- 2452 W Bayshore Rd Unit 8
- 2452 W Bayshore Rd Unit 4
- 2452 W Bayshore Rd Unit 1
- 2452 W Bayshore Rd Unit 3
- 2452 W Bayshore Rd Unit 5
- 2452 W Bayshore Rd Unit 7
- 2452 W Bayshore Rd Unit 9
- 2450 W Bayshore Rd
- 2450 W Bayshore Rd Unit 2
- 2450 W Bayshore Rd Unit 4
- 2450 W Bayshore Rd Unit 6
- 2450 W Bayshore Rd Unit 8
- 2450 W Bayshore Rd Unit 10
- 2450 W Bayshore Rd Unit 12
- 2450 W Bayshore Rd Unit 11
- 2450 W Bayshore Rd Unit 9
- 2450 W Bayshore Rd Unit 7
- 2450 W Bayshore Rd Unit 5