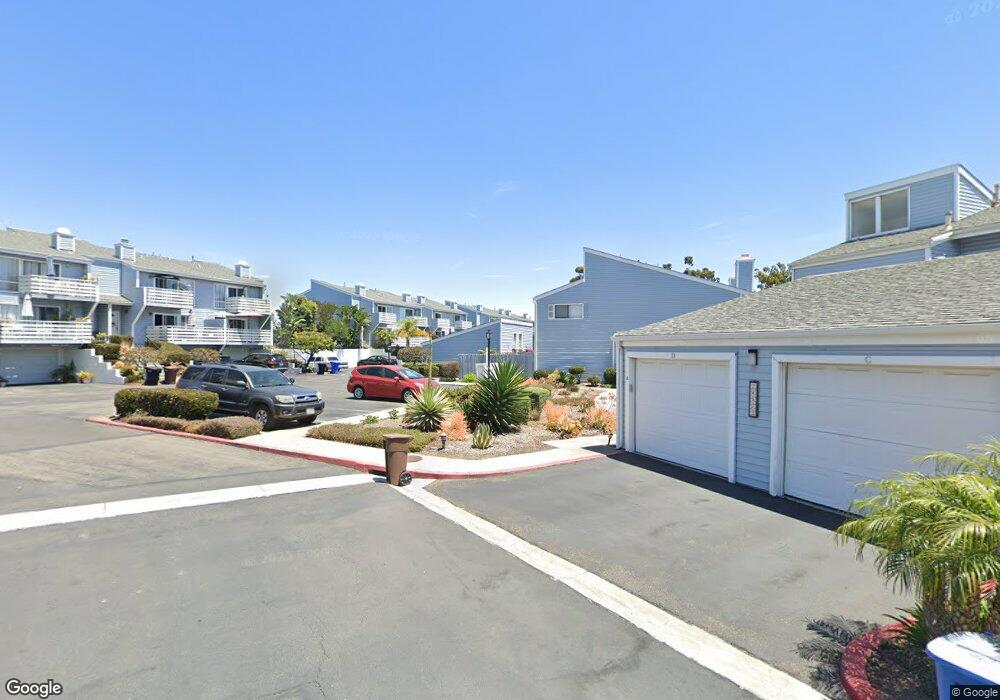
24572 Harbor View Dr Unit C Dana Point, CA 92629
Dana Hills NeighborhoodEstimated Value: $1,193,449 - $1,364,000
3
Beds
3
Baths
1,520
Sq Ft
$854/Sq Ft
Est. Value
About This Home
This home is located at 24572 Harbor View Dr Unit C, Dana Point, CA 92629 and is currently estimated at $1,298,612, approximately $854 per square foot. 24572 Harbor View Dr Unit C is a home located in Orange County with nearby schools including Richard Henry Dana Elementary School, Marco Forster Middle School, and Dana Hills High School.
Ownership History
Date
Name
Owned For
Owner Type
Purchase Details
Closed on
Feb 21, 2007
Sold by
Gable Robin and Osborne Suzanne
Bought by
Gable Robin
Current Estimated Value
Home Financials for this Owner
Home Financials are based on the most recent Mortgage that was taken out on this home.
Original Mortgage
$378,000
Outstanding Balance
$220,263
Interest Rate
1%
Mortgage Type
New Conventional
Estimated Equity
$1,078,349
Purchase Details
Closed on
Sep 23, 1993
Sold by
Gable Robin and Osborne Suzanne
Bought by
Gable Robin
Home Financials for this Owner
Home Financials are based on the most recent Mortgage that was taken out on this home.
Original Mortgage
$160,000
Interest Rate
4%
Create a Home Valuation Report for This Property
The Home Valuation Report is an in-depth analysis detailing your home's value as well as a comparison with similar homes in the area
Home Values in the Area
Average Home Value in this Area
Purchase History
| Date | Buyer | Sale Price | Title Company |
|---|---|---|---|
| Gable Robin | -- | First American Title Ins Co | |
| Gable Robin | -- | California Counties Title Co |
Source: Public Records
Mortgage History
| Date | Status | Borrower | Loan Amount |
|---|---|---|---|
| Open | Gable Robin | $378,000 | |
| Closed | Gable Robin | $160,000 |
Source: Public Records
Tax History Compared to Growth
Tax History
| Year | Tax Paid | Tax Assessment Tax Assessment Total Assessment is a certain percentage of the fair market value that is determined by local assessors to be the total taxable value of land and additions on the property. | Land | Improvement |
|---|---|---|---|---|
| 2025 | $4,146 | $237,590 | $115,318 | $122,272 |
| 2024 | $4,146 | $232,932 | $113,057 | $119,875 |
| 2023 | $3,963 | $228,365 | $110,840 | $117,525 |
| 2022 | $3,880 | $223,888 | $108,667 | $115,221 |
| 2021 | $3,824 | $219,499 | $106,537 | $112,962 |
| 2020 | $3,517 | $217,249 | $105,445 | $111,804 |
| 2019 | $3,367 | $212,990 | $103,378 | $109,612 |
| 2018 | $3,297 | $208,814 | $101,351 | $107,463 |
| 2017 | $3,136 | $204,720 | $99,364 | $105,356 |
| 2016 | $3,033 | $200,706 | $97,415 | $103,291 |
| 2015 | $2,922 | $197,692 | $95,952 | $101,740 |
| 2014 | $2,883 | $193,820 | $94,072 | $99,748 |
Source: Public Records
Map
Nearby Homes
- 33611 Dana Vista Dr Unit 31
- 33671 Granada Dr Unit 5
- 24722 Dana Point Dr Unit 347
- 24092 Paseo Corona
- 33695 Blue Lantern St
- 33616 Rising Tide Ct
- 33791 Granada Dr
- 24871 Sherwood Way
- 33371 Cheltam Way Unit 3
- 33371 Cheltam Way Unit 2
- 33737 Chula Vista Ave
- 24965 Seagate Dr
- 33771 Via Capri
- 33931 Granada Dr
- 33852 Silver Lantern St
- 33121 Ocean Ridge
- 33152 Desoto Way
- 33113 Ocean Ridge
- 36 Saint Kitts
- 34021 La Serena Dr
- 24572 Harbor View Dr Unit B
- 24572 Harbor View Dr Unit D
- 24572 Harbor View Dr Unit 46B
- 24572 Harbor View Dr Unit A
- 24592 Harbor View Dr Unit 52D
- 24592 Harbor View Dr Unit A
- 24592 Harbor View Dr Unit D
- 24592 Harbor View Dr Unit C
- 24592 Harbor View Dr Unit B
- 24622 Harbor View Dr Unit A
- 33602 Dana Vista Dr Unit B
- 24612 Harbor View Dr Unit A
- 24622 Harbor View Dr Unit B
- 24612 Harbor View Dr Unit 56D
- 24622 Harbor View Dr Unit 58B
- 24622 Harbor View Dr Unit 59C
- 24612 Harbor View Dr Unit D
- 33602 Dana Vista Dr Unit C
- 33602 Dana Vista Dr Unit 37A
- 24612 Harbor View Dr Unit B