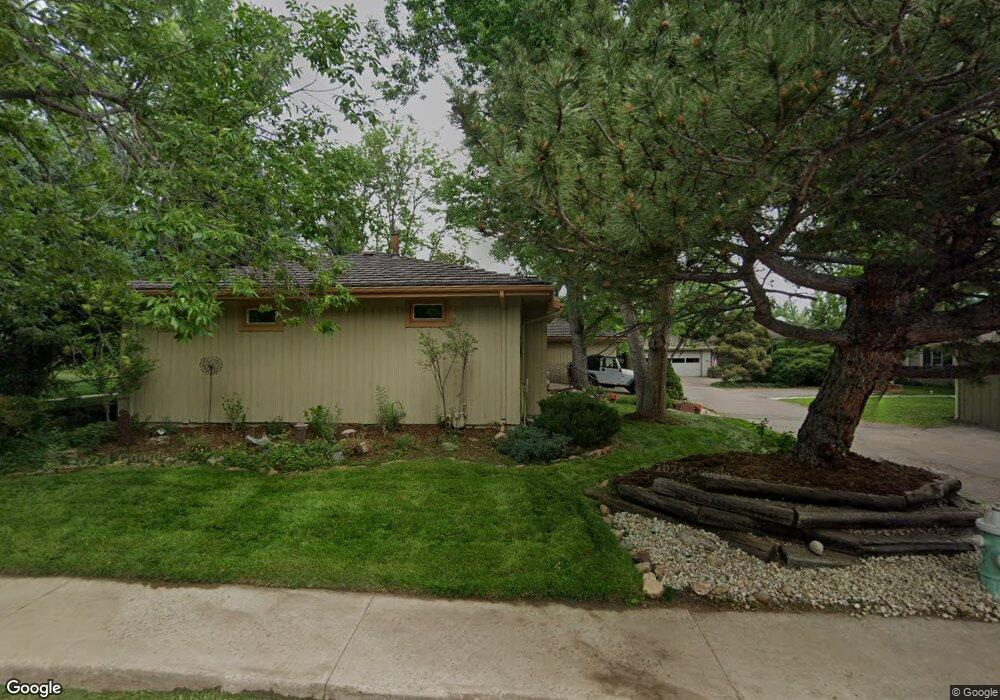
2465 Juniper Ave Boulder, CO 80304
North Boulder NeighborhoodEstimated Value: $993,602 - $1,338,000
2
Beds
3
Baths
2,512
Sq Ft
$491/Sq Ft
Est. Value
About This Home
This home is located at 2465 Juniper Ave, Boulder, CO 80304 and is currently estimated at $1,233,151, approximately $490 per square foot. 2465 Juniper Ave is a home located in Boulder County with nearby schools including Columbine Elementary School, Centennial Middle School, and Boulder High School.
Ownership History
Date
Name
Owned For
Owner Type
Purchase Details
Closed on
May 23, 2018
Sold by
Litt Susan D
Bought by
Litt Susan D
Current Estimated Value
Purchase Details
Closed on
Mar 19, 2008
Sold by
Litt Susan D and Kahn Bruce E
Bought by
Litt Susan D
Purchase Details
Closed on
Aug 7, 2007
Sold by
Queen Jimmie H and Little Ralph L
Bought by
Litt Susan D and Kahn Bruce E
Home Financials for this Owner
Home Financials are based on the most recent Mortgage that was taken out on this home.
Original Mortgage
$300,000
Outstanding Balance
$190,236
Interest Rate
6.69%
Mortgage Type
Purchase Money Mortgage
Estimated Equity
$1,042,915
Purchase Details
Closed on
Nov 26, 1990
Bought by
Litt Susan D and Kahn Bruce E
Purchase Details
Closed on
Sep 30, 1986
Bought by
Litt Susan D and Kahn Bruce E
Purchase Details
Closed on
Mar 23, 1981
Bought by
Litt Susan D and Kahn Bruce E
Purchase Details
Closed on
Feb 24, 1981
Bought by
Litt Susan D and Kahn Bruce E
Create a Home Valuation Report for This Property
The Home Valuation Report is an in-depth analysis detailing your home's value as well as a comparison with similar homes in the area
Home Values in the Area
Average Home Value in this Area
Purchase History
| Date | Buyer | Sale Price | Title Company |
|---|---|---|---|
| Litt Susan D | -- | None Available | |
| Litt Susan D | -- | None Available | |
| Litt Susan D | $569,900 | Fahtco | |
| Litt Susan D | $129,500 | -- | |
| Litt Susan D | $129,500 | -- | |
| Litt Susan D | -- | -- | |
| Litt Susan D | -- | -- |
Source: Public Records
Mortgage History
| Date | Status | Borrower | Loan Amount |
|---|---|---|---|
| Open | Litt Susan D | $300,000 |
Source: Public Records
Tax History
| Year | Tax Paid | Tax Assessment Tax Assessment Total Assessment is a certain percentage of the fair market value that is determined by local assessors to be the total taxable value of land and additions on the property. | Land | Improvement |
|---|---|---|---|---|
| 2025 | $6,671 | $76,700 | $29,869 | $46,831 |
| 2024 | $6,671 | $76,700 | $29,869 | $46,831 |
| 2023 | $6,556 | $82,611 | $31,242 | $55,054 |
| 2022 | $5,374 | $64,823 | $25,368 | $39,455 |
| 2021 | $5,125 | $66,689 | $26,098 | $40,591 |
| 2020 | $4,955 | $64,078 | $26,598 | $37,480 |
| 2019 | $4,879 | $64,078 | $26,598 | $37,480 |
| 2018 | $4,371 | $57,614 | $25,200 | $32,414 |
| 2017 | $4,839 | $63,696 | $27,860 | $35,836 |
| 2016 | $4,421 | $51,072 | $22,925 | $28,147 |
| 2015 | $4,186 | $40,620 | $14,965 | $25,655 |
| 2014 | $3,415 | $40,620 | $14,965 | $25,655 |
Source: Public Records
Map
Nearby Homes
- 2540 Iris Ave
- 2636 Juniper Ave Unit 1
- 2652 Sherwood Cir
- 2645 Tabriz Place Unit 22
- 2435 Hawthorn Ave
- 2624 Kalmia Ave
- 3535 28th St Unit 101
- 3545 28th St Unit 304
- 2270 Grape Ave
- 3225 Arnett St
- 2595 Glenwood Dr
- 3565 28th St Unit 305
- 2025 Hermosa Dr
- 3575 28th St Unit 104
- 3737 26th St
- 2006 Joslyn Place
- 3621 21st St
- 2055 Kalmia Ave
- 2672 Winding Trail Dr
- 2800 Kalmia Ave Unit A306
- 2455 Juniper Ave
- 2495 Juniper Ave
- 2475 Juniper Ave
- 2445 Juniper Ave
- 2485 Juniper Ave
- 2460 Juniper Ave
- 2505 Juniper Ave
- 2415 Juniper Ave
- 2440 Juniper Ave
- 2480 Juniper Ave
- 2410 Jasper Ct
- 2515 Juniper Ave
- 2400 Jasper Ct
- 2395 Juniper Ave
- 2420 Juniper Ave
- 2555 Juniper Ave
- 2500 Juniper Ave
- 2390 23rd St
- 2545 Juniper Ave
- 2415 Jasper Ct
Your Personal Tour Guide
Ask me questions while you tour the home.