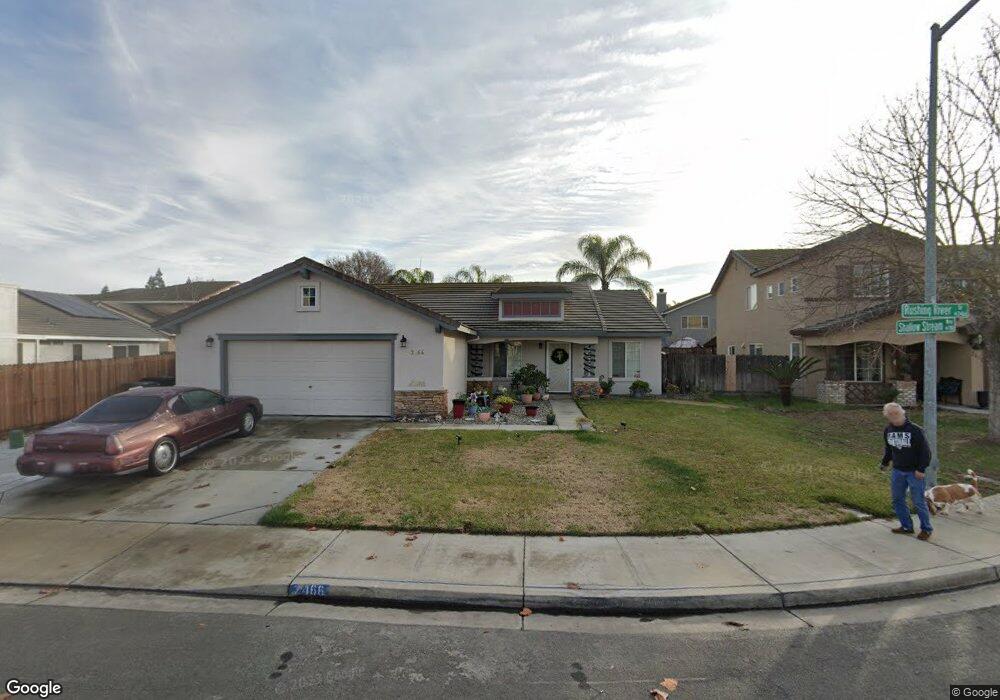
2466 Rushing River Dr Modesto, CA 95351
Bystorm NeighborhoodEstimated Value: $337,000 - $482,000
3
Beds
2
Baths
1,664
Sq Ft
$257/Sq Ft
Est. Value
About This Home
This home is located at 2466 Rushing River Dr, Modesto, CA 95351 and is currently estimated at $427,179, approximately $256 per square foot. 2466 Rushing River Dr is a home located in Stanislaus County with nearby schools including Virginia Parks Elementary School, Mae Hensley Junior High School, and Ceres High School.
Ownership History
Date
Name
Owned For
Owner Type
Purchase Details
Closed on
Feb 23, 2015
Sold by
Rodgers Randi L
Bought by
Rodgers Randi L and Rodgers Tara J
Current Estimated Value
Home Financials for this Owner
Home Financials are based on the most recent Mortgage that was taken out on this home.
Original Mortgage
$134,400
Outstanding Balance
$102,213
Interest Rate
3.57%
Mortgage Type
New Conventional
Estimated Equity
$324,966
Purchase Details
Closed on
Jul 24, 2001
Sold by
Rodgers Randi L and Rogers Randi L
Bought by
Rodgers Randi L
Home Financials for this Owner
Home Financials are based on the most recent Mortgage that was taken out on this home.
Original Mortgage
$152,800
Interest Rate
7.15%
Purchase Details
Closed on
Jun 16, 1999
Sold by
Florsheim Bros
Bought by
Rogers Randi L
Home Financials for this Owner
Home Financials are based on the most recent Mortgage that was taken out on this home.
Original Mortgage
$140,235
Interest Rate
7.51%
Mortgage Type
FHA
Create a Home Valuation Report for This Property
The Home Valuation Report is an in-depth analysis detailing your home's value as well as a comparison with similar homes in the area
Home Values in the Area
Average Home Value in this Area
Purchase History
| Date | Buyer | Sale Price | Title Company |
|---|---|---|---|
| Rodgers Randi L | -- | None Available | |
| Rodgers Randi L | -- | Chicago Title Co | |
| Rogers Randi L | $142,500 | Chicago Title |
Source: Public Records
Mortgage History
| Date | Status | Borrower | Loan Amount |
|---|---|---|---|
| Open | Rodgers Randi L | $134,400 | |
| Closed | Rodgers Randi L | $152,800 | |
| Closed | Rogers Randi L | $140,235 | |
| Closed | Rogers Randi L | $7,110 |
Source: Public Records
Tax History Compared to Growth
Tax History
| Year | Tax Paid | Tax Assessment Tax Assessment Total Assessment is a certain percentage of the fair market value that is determined by local assessors to be the total taxable value of land and additions on the property. | Land | Improvement |
|---|---|---|---|---|
| 2025 | $2,513 | $218,230 | $49,171 | $169,059 |
| 2024 | $2,356 | $213,952 | $48,207 | $165,745 |
| 2023 | $2,290 | $209,758 | $47,262 | $162,496 |
| 2022 | $2,269 | $205,646 | $46,336 | $159,310 |
| 2021 | $2,244 | $201,615 | $45,428 | $156,187 |
| 2020 | $2,174 | $199,549 | $44,963 | $154,586 |
| 2019 | $2,158 | $195,637 | $44,082 | $151,555 |
| 2018 | $2,112 | $191,802 | $43,218 | $148,584 |
| 2017 | $2,094 | $188,042 | $42,371 | $145,671 |
| 2016 | $2,049 | $184,356 | $41,541 | $142,815 |
| 2015 | $2,021 | $181,588 | $40,918 | $140,670 |
| 2014 | $1,979 | $178,032 | $40,117 | $137,915 |
Source: Public Records
Map
Nearby Homes
- 810 River Raft Ct
- 739 Shallow Stream Way
- 2120 River Rd
- 2509 E Hatch Rd
- 2511 E Hatch Rd
- 1210 Snow Ridge Ct
- 1415 Villa Way
- 2900 Canyon Falls Dr
- 2816 Canyon Dr
- 2845 E Hatch Rd Unit 86
- 1645 Moffett Rd
- 1301 Stonum Rd
- 1647 Moffett Rd
- 932 Yellow Brick Rd
- 1651 Moffett Rd
- 1542 Rose Ave
- 0 5th St
- 1655 Moffett Rd
- 1743 Woodworth Ave
- 2602 Parkway
- 2452 Rushing River Dr
- 797 Rolling Oak Ct
- 811 Rolling Oak Ct
- 2481 Whitewater Way
- 2467 Whitewater Way
- 2438 Rushing River Dr
- 825 Rolling Oak Ct
- 2467 Rushing River Dr
- 2453 Whitewater Way
- 2481 Rushing River Dr
- 781 Shallow Stream Way
- 2495 Rushing River Dr
- 767 Shallow Stream Way
- 2501 Rushing River Dr
- 824 River Raft Ct
- 740 Shallow Stream Way
- 798 Rolling Oak Ct
- 812 Rolling Oak Ct
- 2480 Whitewater Way
- 845 Rolling Oak Ct