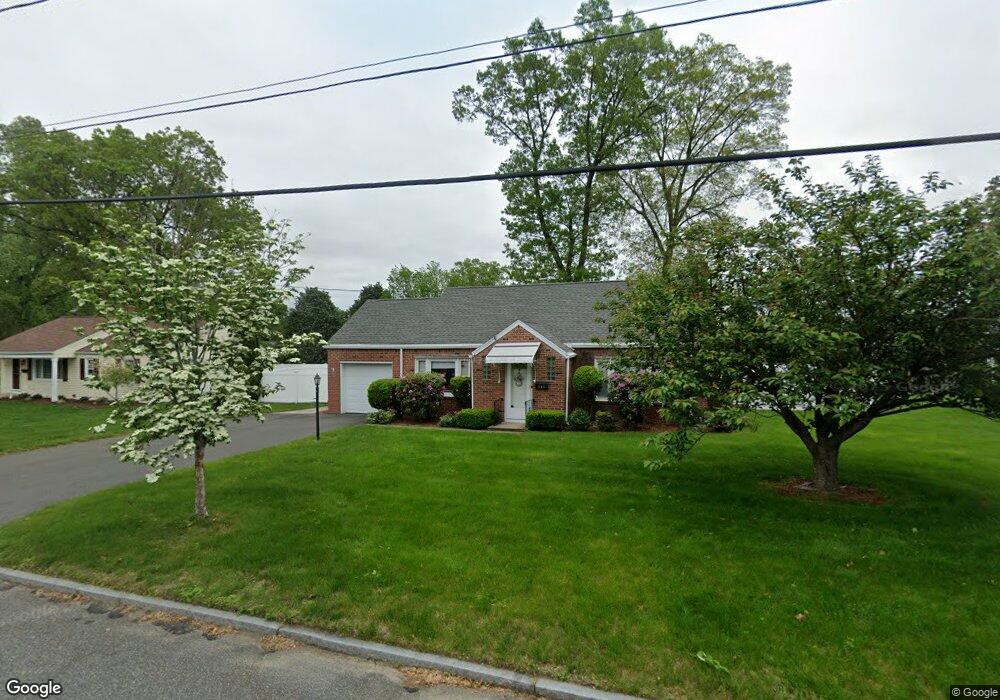
247 Winton St Springfield, MA 01118
East Forest Park NeighborhoodEstimated Value: $312,000 - $331,000
4
Beds
1
Bath
1,230
Sq Ft
$263/Sq Ft
Est. Value
About This Home
This home is located at 247 Winton St, Springfield, MA 01118 and is currently estimated at $323,724, approximately $263 per square foot. 247 Winton St is a home located in Hampden County with nearby schools including Mary A. Dryden Veterans Memorial School, M Marcus Kiley Middle, and Springfield High School of Science and Technology.
Ownership History
Date
Name
Owned For
Owner Type
Purchase Details
Closed on
Sep 23, 2022
Sold by
Benoit Judith A
Bought by
Mooneyham Aimee and Mull Melissa
Current Estimated Value
Purchase Details
Closed on
Mar 12, 1999
Sold by
Lorenzatti Josephine P
Bought by
Benoit Judith A and Benoit Allen R
Home Financials for this Owner
Home Financials are based on the most recent Mortgage that was taken out on this home.
Original Mortgage
$60,000
Interest Rate
6.73%
Mortgage Type
Purchase Money Mortgage
Create a Home Valuation Report for This Property
The Home Valuation Report is an in-depth analysis detailing your home's value as well as a comparison with similar homes in the area
Home Values in the Area
Average Home Value in this Area
Purchase History
| Date | Buyer | Sale Price | Title Company |
|---|---|---|---|
| Mooneyham Aimee | -- | None Available | |
| Benoit Judith A | $84,400 | -- |
Source: Public Records
Mortgage History
| Date | Status | Borrower | Loan Amount |
|---|---|---|---|
| Previous Owner | Benoit Judith A | $60,000 | |
| Closed | Benoit Judith A | $1,000 |
Source: Public Records
Tax History Compared to Growth
Tax History
| Year | Tax Paid | Tax Assessment Tax Assessment Total Assessment is a certain percentage of the fair market value that is determined by local assessors to be the total taxable value of land and additions on the property. | Land | Improvement |
|---|---|---|---|---|
| 2025 | $4,728 | $301,500 | $48,400 | $253,100 |
| 2024 | $4,306 | $268,100 | $48,400 | $219,700 |
| 2023 | $4,496 | $263,700 | $46,100 | $217,600 |
| 2022 | $3,819 | $202,900 | $46,100 | $156,800 |
| 2021 | $3,704 | $196,000 | $41,900 | $154,100 |
| 2020 | $3,635 | $186,100 | $41,900 | $144,200 |
| 2019 | $3,363 | $170,900 | $41,900 | $129,000 |
| 2018 | $3,369 | $171,200 | $41,900 | $129,300 |
| 2017 | $3,254 | $165,500 | $41,900 | $123,600 |
| 2016 | $3,146 | $160,000 | $41,900 | $118,100 |
| 2015 | $3,185 | $161,900 | $41,900 | $120,000 |
Source: Public Records
Map
Nearby Homes