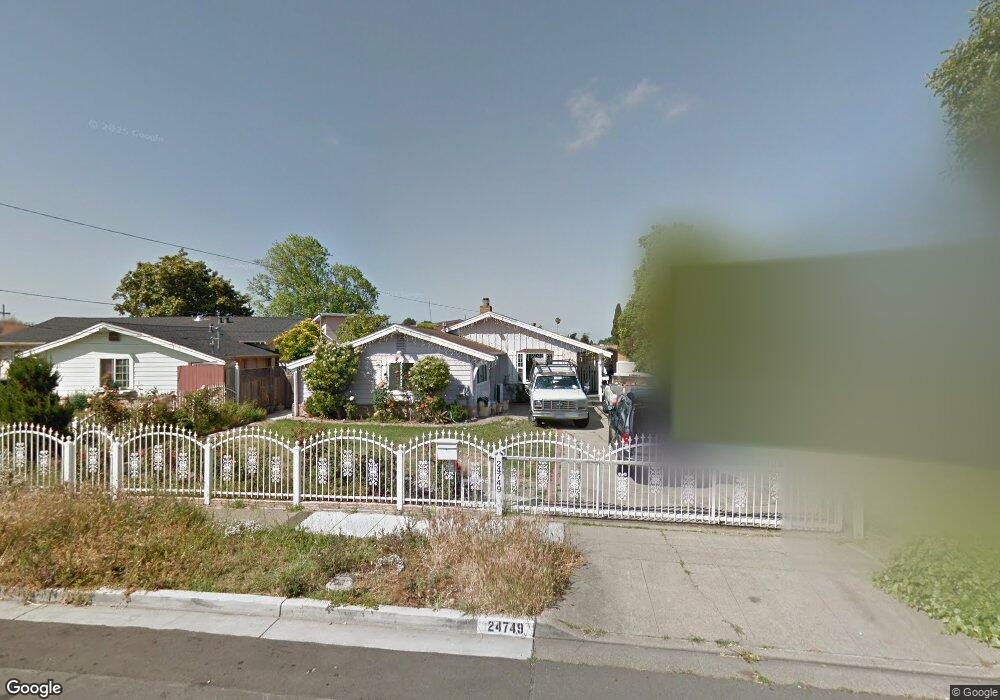
24749 Calaroga Ave Hayward, CA 94545
Southgate NeighborhoodEstimated Value: $867,000 - $1,020,000
4
Beds
3
Baths
2,074
Sq Ft
$469/Sq Ft
Est. Value
About This Home
This home is located at 24749 Calaroga Ave, Hayward, CA 94545 and is currently estimated at $973,142, approximately $469 per square foot. 24749 Calaroga Ave is a home located in Alameda County with nearby schools including Eden Gardens Elementary School, Anthony W. Ochoa Middle School, and Mt. Eden High School.
Ownership History
Date
Name
Owned For
Owner Type
Purchase Details
Closed on
Apr 11, 2011
Sold by
Citibank Na
Bought by
Rahnama Mohamad K and Araujo Silvia
Current Estimated Value
Home Financials for this Owner
Home Financials are based on the most recent Mortgage that was taken out on this home.
Original Mortgage
$256,000
Outstanding Balance
$175,955
Interest Rate
4.72%
Mortgage Type
New Conventional
Estimated Equity
$797,187
Purchase Details
Closed on
Jun 11, 2010
Sold by
Yared Joel T and Yared Narisa M
Bought by
Citibank Na
Purchase Details
Closed on
Jun 29, 2004
Sold by
Casino Isabelo A and Casino Lorna D
Bought by
Yared Joel T and Yared Narisa M
Home Financials for this Owner
Home Financials are based on the most recent Mortgage that was taken out on this home.
Original Mortgage
$412,000
Interest Rate
6.31%
Mortgage Type
Stand Alone First
Purchase Details
Closed on
May 6, 1999
Sold by
Nelson Donald L and Nelson Janet D
Bought by
Casino Isabelo A and Casino Lorna D
Home Financials for this Owner
Home Financials are based on the most recent Mortgage that was taken out on this home.
Original Mortgage
$210,240
Interest Rate
6.92%
Mortgage Type
Stand Alone First
Create a Home Valuation Report for This Property
The Home Valuation Report is an in-depth analysis detailing your home's value as well as a comparison with similar homes in the area
Home Values in the Area
Average Home Value in this Area
Purchase History
| Date | Buyer | Sale Price | Title Company |
|---|---|---|---|
| Rahnama Mohamad K | $320,000 | North American Title Group | |
| Citibank Na | $388,000 | North American Title Company | |
| Yared Joel T | $515,000 | First American Title Company | |
| Casino Isabelo A | $263,000 | Fidelity National Title |
Source: Public Records
Mortgage History
| Date | Status | Borrower | Loan Amount |
|---|---|---|---|
| Open | Rahnama Mohamad K | $256,000 | |
| Previous Owner | Yared Joel T | $412,000 | |
| Previous Owner | Casino Isabelo A | $210,240 | |
| Closed | Casino Isabelo A | $26,280 |
Source: Public Records
Tax History
| Year | Tax Paid | Tax Assessment Tax Assessment Total Assessment is a certain percentage of the fair market value that is determined by local assessors to be the total taxable value of land and additions on the property. | Land | Improvement |
|---|---|---|---|---|
| 2025 | $5,131 | $409,951 | $122,985 | $286,966 |
| 2024 | $5,131 | $401,916 | $120,575 | $281,341 |
| 2023 | $5,056 | $394,037 | $118,211 | $275,826 |
| 2022 | $4,960 | $386,313 | $115,894 | $270,419 |
| 2021 | $4,920 | $378,738 | $113,621 | $265,117 |
| 2020 | $4,867 | $374,857 | $112,457 | $262,400 |
| 2019 | $4,905 | $367,510 | $110,253 | $257,257 |
| 2018 | $4,609 | $360,307 | $108,092 | $252,215 |
| 2017 | $4,505 | $353,244 | $105,973 | $247,271 |
| 2016 | $4,243 | $346,320 | $103,896 | $242,424 |
| 2015 | $4,160 | $341,120 | $102,336 | $238,784 |
| 2014 | $3,955 | $334,437 | $100,331 | $234,106 |
Source: Public Records
Map
Nearby Homes
- 24768 Mango St
- 24704 Manzanita St
- 25164 Copa Del Oro Dr Unit 104
- 25055 Copa Del Oro Dr Unit 102
- 25163 Copa Del Oro Dr Unit 202
- 25129 Copa Del Oro Dr Unit 102
- 25827 Calaroga Ave
- 937 Neil Way
- 1280 Stanhope Ln Unit 246
- 1256 Stanhope Ln Unit 254
- 1256 Stanhope Ln Unit 154
- 24825 Santa Clara St
- 512 Teasdale Place
- 1510 Cathy Way
- 25938 Kay Ave Unit 322
- 26088 Kay Ave Unit 318
- 26088 Kay Ave Unit 209
- 1131 Bishop Ave
- 1150 W Winton Ave Unit 207
- 1150 W Winton Ave Unit 204
- 24757 Calaroga Ave
- 24758 Papaya St
- 24765 Calaroga Ave
- 24733 Calaroga Ave
- 973 Currant Way
- 24766 Papaya St
- 24771 Calaroga Ave
- 24725 Calaroga Ave
- 981 Currant Way
- 24756 Calaroga Ave
- 24748 Calaroga Ave
- 24764 Calaroga Ave
- 24717 Calaroga Ave
- 24782 Papaya St
- 24779 Calaroga Ave
- 24740 Calaroga Ave
- 989 Currant Way
- 24772 Calaroga Ave
- 24732 Calaroga Ave
- 24790 Papaya St
Your Personal Tour Guide
Ask me questions while you tour the home.