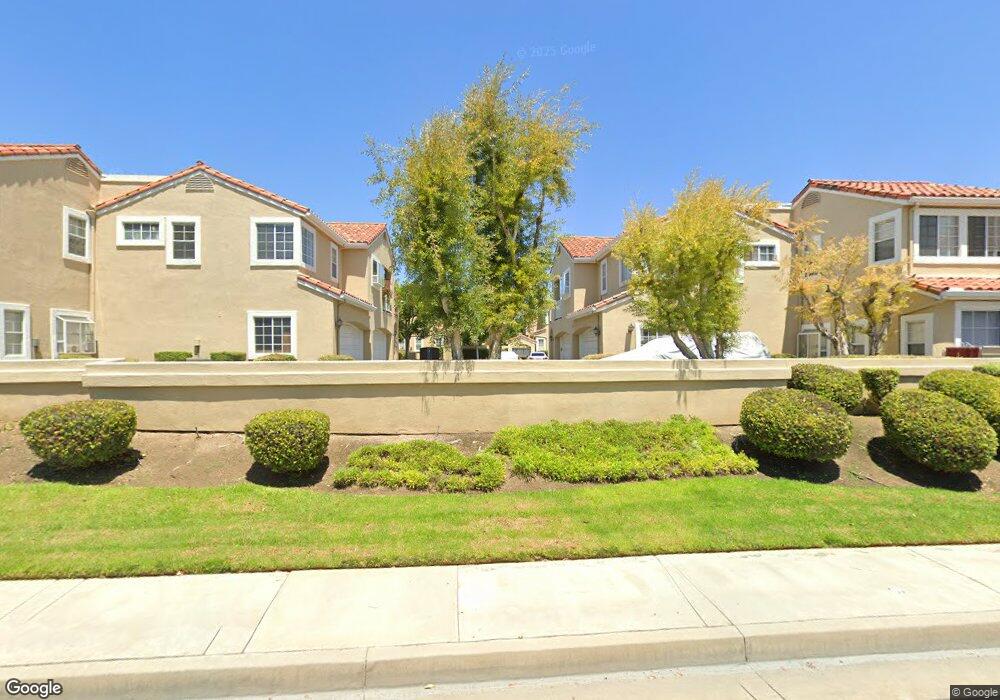
2479 Paseo Circulo Unit 132 Tustin, CA 92782
Tustin Ranch NeighborhoodEstimated Value: $975,392 - $1,110,000
2
Beds
3
Baths
1,590
Sq Ft
$659/Sq Ft
Est. Value
About This Home
This home is located at 2479 Paseo Circulo Unit 132, Tustin, CA 92782 and is currently estimated at $1,047,848, approximately $659 per square foot. 2479 Paseo Circulo Unit 132 is a home located in Orange County with nearby schools including Tustin Ranch Elementary School, Pioneer Middle School, and Arnold O. Beckman High School.
Ownership History
Date
Name
Owned For
Owner Type
Purchase Details
Closed on
May 7, 2024
Sold by
Hubbard Clint L and Hubbard Clinton L
Bought by
Chesapeake Bay Company Llc
Current Estimated Value
Purchase Details
Closed on
Aug 19, 1997
Sold by
William Adam and William Patricia H
Bought by
Hubbard Clint L and Hubbard Sheila K
Home Financials for this Owner
Home Financials are based on the most recent Mortgage that was taken out on this home.
Original Mortgage
$151,000
Interest Rate
7.44%
Purchase Details
Closed on
Nov 17, 1993
Sold by
Adam David F and Adam Julianne M
Bought by
Adam William and Adam Patricia H
Home Financials for this Owner
Home Financials are based on the most recent Mortgage that was taken out on this home.
Original Mortgage
$188,000
Interest Rate
6.88%
Create a Home Valuation Report for This Property
The Home Valuation Report is an in-depth analysis detailing your home's value as well as a comparison with similar homes in the area
Home Values in the Area
Average Home Value in this Area
Purchase History
| Date | Buyer | Sale Price | Title Company |
|---|---|---|---|
| Chesapeake Bay Company Llc | -- | None Listed On Document | |
| Hubbard Clint L | $195,000 | Fidelity National Title Ins | |
| Adam William | -- | South Coast Title Company |
Source: Public Records
Mortgage History
| Date | Status | Borrower | Loan Amount |
|---|---|---|---|
| Previous Owner | Hubbard Clint L | $151,000 | |
| Previous Owner | Adam William | $188,000 |
Source: Public Records
Tax History
| Year | Tax Paid | Tax Assessment Tax Assessment Total Assessment is a certain percentage of the fair market value that is determined by local assessors to be the total taxable value of land and additions on the property. | Land | Improvement |
|---|---|---|---|---|
| 2025 | $3,246 | $311,351 | $111,452 | $199,899 |
| 2024 | $3,246 | $305,247 | $109,267 | $195,980 |
| 2023 | $3,172 | $299,262 | $107,124 | $192,138 |
| 2022 | $3,654 | $293,395 | $105,024 | $188,371 |
| 2021 | $3,571 | $287,643 | $102,965 | $184,678 |
| 2020 | $3,516 | $284,694 | $101,909 | $182,785 |
| 2019 | $3,449 | $279,112 | $99,911 | $179,201 |
| 2018 | $3,371 | $273,640 | $97,952 | $175,688 |
| 2017 | $3,265 | $268,275 | $96,031 | $172,244 |
| 2016 | $3,208 | $263,015 | $94,148 | $168,867 |
| 2015 | $3,177 | $259,065 | $92,734 | $166,331 |
| 2014 | $3,148 | $253,991 | $90,918 | $163,073 |
Source: Public Records
Map
Nearby Homes
- 13440 Savanna
- 2800 Keller Dr Unit 243
- 2800 Keller Dr Unit 249
- 12891 Mackenzie Dr Unit 86
- 2196 Evergreen Dr
- 2061 Pueblo
- 2231 Huntley Dr
- 13392 Farmington Rd
- 13181 Hickory Branch Rd
- 12665 Stanton Ave
- 2828 Ballesteros Ln
- 1701 Saybrook Ln
- 12581 Doral Unit 54
- 12605 Prescott Ave
- 13541 Dean St
- 13561 Dean St
- 12721 Trent Jones Ln
- 2894 Player Ln
- 74 Seville St Unit 74
- 2321 Fuschia Ln
- 2475 Paseo Circulo
- 2477 Paseo Circulo Unit 131
- 2473 Paseo Circulo
- 2471 Paseo Circulo Unit 128
- 2483 Paseo Circulo
- 2465 Paseo Circulo
- 2456 Paseo Circulo
- 2485 Paseo Circulo Unit 135
- 2463 Paseo Circulo Unit 126
- 2463 Paseo Circulo
- 2461 Paseo Circulo
- 2458 Paseo Circulo Unit 119
- 2454 Paseo Circulo
- 2487 Paseo Circulo Unit 100
- 2487 Paseo Circulo
- 2559 Avenita Alpera
- 2488 Paseo Circulo Unit 114
- 2481 Paseo Circulo
- 2557 Avenita Alpera
- 2486 Paseo Circulo
Your Personal Tour Guide
Ask me questions while you tour the home.