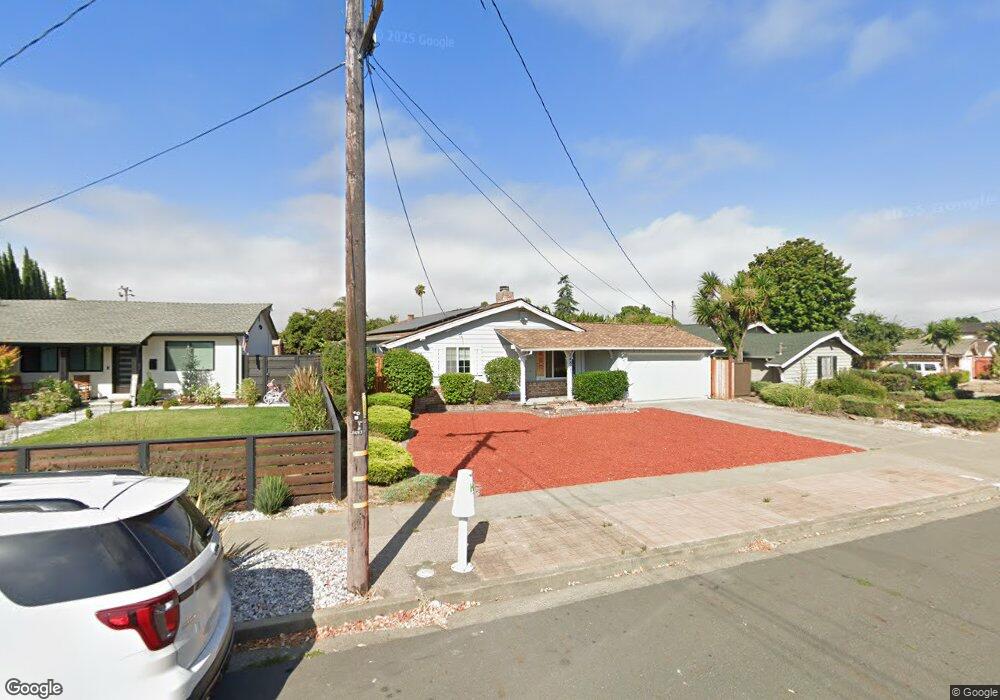
24867 Calaroga Ave Hayward, CA 94545
Southgate NeighborhoodEstimated Value: $896,000 - $955,000
3
Beds
2
Baths
1,215
Sq Ft
$761/Sq Ft
Est. Value
About This Home
This home is located at 24867 Calaroga Ave, Hayward, CA 94545 and is currently estimated at $924,516, approximately $760 per square foot. 24867 Calaroga Ave is a home located in Alameda County with nearby schools including Eden Gardens Elementary School, Anthony W. Ochoa Middle School, and Mt. Eden High School.
Ownership History
Date
Name
Owned For
Owner Type
Purchase Details
Closed on
Apr 10, 2019
Sold by
James And Tereasa Riccio Living Trus
Bought by
Ho Wai Bing and Ong Pei Fean
Current Estimated Value
Home Financials for this Owner
Home Financials are based on the most recent Mortgage that was taken out on this home.
Original Mortgage
$420,000
Outstanding Balance
$375,122
Interest Rate
5.12%
Mortgage Type
Adjustable Rate Mortgage/ARM
Estimated Equity
$549,394
Purchase Details
Closed on
Sep 8, 2011
Sold by
Riccio James Anthony and Riccio Tereasa Madelyn
Bought by
Riccio James A and Riccio Tereasa M
Purchase Details
Closed on
Mar 27, 2008
Sold by
Riccio James Anthony and Riccio Teresa Madelyn
Bought by
Riccio James Anthony and Riccio Teresa Madelyn
Home Financials for this Owner
Home Financials are based on the most recent Mortgage that was taken out on this home.
Original Mortgage
$247,500
Interest Rate
6.04%
Mortgage Type
New Conventional
Create a Home Valuation Report for This Property
The Home Valuation Report is an in-depth analysis detailing your home's value as well as a comparison with similar homes in the area
Home Values in the Area
Average Home Value in this Area
Purchase History
| Date | Buyer | Sale Price | Title Company |
|---|---|---|---|
| Ho Wai Bing | $720,000 | Chicago Title Company | |
| Riccio James A | -- | None Available | |
| Riccio James Anthony | -- | Lenders Choice Title |
Source: Public Records
Mortgage History
| Date | Status | Borrower | Loan Amount |
|---|---|---|---|
| Open | Ho Wai Bing | $420,000 | |
| Previous Owner | Riccio James Anthony | $247,500 |
Source: Public Records
Tax History Compared to Growth
Tax History
| Year | Tax Paid | Tax Assessment Tax Assessment Total Assessment is a certain percentage of the fair market value that is determined by local assessors to be the total taxable value of land and additions on the property. | Land | Improvement |
|---|---|---|---|---|
| 2025 | $9,613 | $796,160 | $240,948 | $562,212 |
| 2024 | $9,613 | $780,413 | $236,224 | $551,189 |
| 2023 | $9,468 | $771,976 | $231,593 | $540,383 |
| 2022 | $9,281 | $749,841 | $227,052 | $529,789 |
| 2021 | $9,205 | $735,002 | $222,600 | $519,402 |
| 2020 | $9,102 | $734,400 | $220,320 | $514,080 |
| 2019 | $1,983 | $138,075 | $73,099 | $64,976 |
| 2018 | $1,875 | $135,368 | $71,665 | $63,703 |
| 2017 | $1,836 | $132,714 | $70,260 | $62,454 |
| 2016 | $1,714 | $130,112 | $68,883 | $61,229 |
| 2015 | $1,683 | $128,158 | $67,848 | $60,310 |
| 2014 | $1,608 | $125,648 | $66,520 | $59,128 |
Source: Public Records
Map
Nearby Homes
- 25163 Copa Del Oro Dr Unit 202
- 1280 Stanhope Ln Unit 343
- 1256 Stanhope Ln Unit 254
- 1234 Stanhope Ln Unit 267
- 512 Teasdale Place
- 25930 Kay Ave Unit 201
- 25930 Kay Ave Unit 308
- 26171 Eldridge Ave
- 522 Lagunitas Ln
- 565 Lagunitas Ln
- 24282 Willimet Way
- 1291 Xavier Ave
- 25275 Tarman Ave
- 25353 Tarman Ave
- 828 Bluefield Ln
- 26754 Contessa St
- 24970 Cypress Ave
- 25322 Ironwood Ct
- 26623 Eldridge Ave
- 462 Craven Ct
- 24937 Calaroga Ave
- 24855 Calaroga Ave
- 24906 Papaya St
- 24868 Papaya St
- 24843 Calaroga Ave
- 24949 Calaroga Ave
- 24934 Papaya St
- 24850 Papaya St
- 24827 Calaroga Ave
- 24962 Papaya St
- 24832 Papaya St
- 24878 Calaroga Ave
- 24985 Calaroga Ave
- 24936 Calaroga Ave
- 24866 Calaroga Ave
- 24815 Calaroga Ave
- 24948 Calaroga Ave
- 24970 Papaya St
- 24854 Calaroga Ave
- 24814 Papaya St