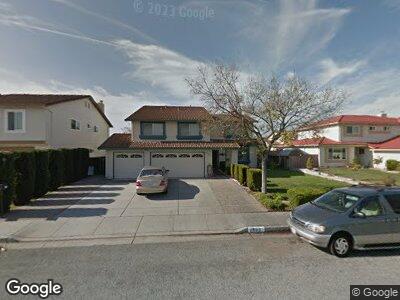
2495 Glen Elm Way San Jose, CA 95148
Hidden Glen NeighborhoodEstimated Value: $1,609,000 - $1,744,562
4
Beds
3
Baths
2,946
Sq Ft
$562/Sq Ft
Est. Value
About This Home
This home is located at 2495 Glen Elm Way, San Jose, CA 95148 and is currently estimated at $1,655,391, approximately $561 per square foot. 2495 Glen Elm Way is a home located in Santa Clara County with nearby schools including Cedar Grove Elementary School, George V. Leyva Intermediate School, and William C. Overfelt High School.
Ownership History
Date
Name
Owned For
Owner Type
Purchase Details
Closed on
Dec 31, 2016
Sold by
Chau Liet Sang and Kong Lynn
Bought by
Chau Liet Sang and Kong Lynn
Current Estimated Value
Home Financials for this Owner
Home Financials are based on the most recent Mortgage that was taken out on this home.
Original Mortgage
$450,752
Interest Rate
4.25%
Mortgage Type
FHA
Purchase Details
Closed on
Nov 12, 1993
Sold by
Hoang Jacqueline and Hoang Neil
Bought by
Chau Liet Sang and Mui Giang
Home Financials for this Owner
Home Financials are based on the most recent Mortgage that was taken out on this home.
Original Mortgage
$252,900
Interest Rate
6.88%
Create a Home Valuation Report for This Property
The Home Valuation Report is an in-depth analysis detailing your home's value as well as a comparison with similar homes in the area
Home Values in the Area
Average Home Value in this Area
Purchase History
| Date | Buyer | Sale Price | Title Company |
|---|---|---|---|
| Chau Liet Sang | -- | Wfg National Title Ins Co | |
| Chau Liet Sang | $288,000 | North American Title Company |
Source: Public Records
Mortgage History
| Date | Status | Borrower | Loan Amount |
|---|---|---|---|
| Open | Chau Liet Sang | $590,000 | |
| Closed | Chau Liet Sang | $200,000 | |
| Closed | Chau Liet Sang | $450,752 | |
| Closed | Chau Liet Sang | $500,000 | |
| Closed | Chau Liet Sang | $178,220 | |
| Closed | Chau Liet Sang | $275,000 | |
| Closed | Chau Liet Sang | $40,000 | |
| Closed | Chau Liet Sang | $227,000 | |
| Previous Owner | Chau Liet Sang | $252,900 |
Source: Public Records
Tax History Compared to Growth
Tax History
| Year | Tax Paid | Tax Assessment Tax Assessment Total Assessment is a certain percentage of the fair market value that is determined by local assessors to be the total taxable value of land and additions on the property. | Land | Improvement |
|---|---|---|---|---|
| 2024 | $8,341 | $482,885 | $152,956 | $329,929 |
| 2023 | $8,148 | $473,417 | $149,957 | $323,460 |
| 2022 | $8,084 | $464,135 | $147,017 | $317,118 |
| 2021 | $7,882 | $455,035 | $144,135 | $310,900 |
| 2020 | $7,477 | $450,371 | $142,658 | $307,713 |
| 2019 | $7,253 | $441,541 | $139,861 | $301,680 |
| 2018 | $7,146 | $432,884 | $137,119 | $295,765 |
| 2017 | $7,113 | $424,397 | $134,431 | $289,966 |
| 2016 | $6,788 | $416,077 | $131,796 | $284,281 |
| 2015 | $6,701 | $409,828 | $129,817 | $280,011 |
| 2014 | $5,722 | $401,801 | $127,275 | $274,526 |
Source: Public Records
Map
Nearby Homes
- 2507 Scottsdale Dr
- 2531 Glen Kew Ct
- 2424 Britt Way
- 2733 Scottsdale Dr
- 2749 Scottsdale Dr
- 2496 Sturla Dr
- 2614 Whispering Hills Cir Unit 2614
- 2552 Castleton Dr
- 3065 Centerwood Way
- 2574 Whispering Hills Cir Unit 2574
- 2684 Whispering Hills Dr Unit 2684
- 2192 Pastoral Loop
- 2195 Cunningham Ct
- 1805 Quimby Rd Unit 1805
- 1837 Quimby Rd Unit 1837
- 2680 Flint Ave
- 3063 Lynview Dr
- 2698 Tranquility St
- 3334 Dias Dr
- 2160 Mendota Way
- 2495 Glen Elm Way
- 2499 Glen Elm Way
- 2491 Glen Elm Way
- 2594 Glen Keller Ct
- 2503 Glen Elm Way
- 2590 Glen Keller Ct
- 2487 Glen Elm Way
- 2496 Glen Elm Way
- 2821 Glen Donegal Dr
- 2492 Glen Elm Way
- 2598 Glen Keller Ct
- 2500 Glen Elm Way
- 2586 Glen Keller Ct
- 2817 Glen Donegal Dr
- 2504 Glen Elm Way
- 2595 Glen Dundee Ct
- 2813 Glen Donegal Dr
- 2591 Glen Dundee Ct
- 2597 Glen Keller Ct
- 2841 Glen Donegal Dr