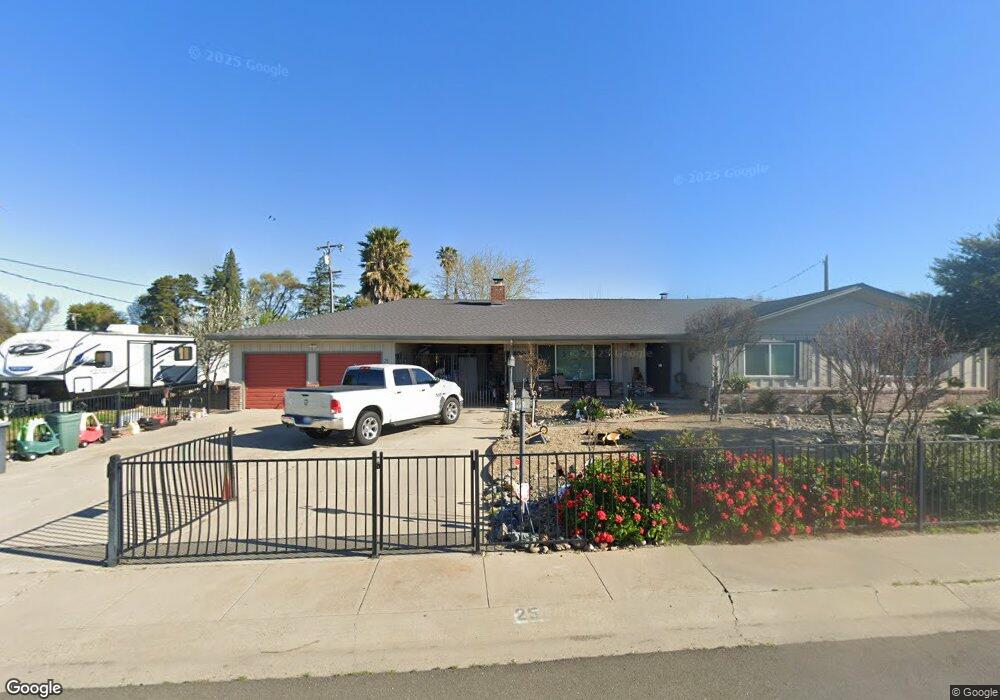
25 3rd Ave Isleton, CA 95641
Estimated Value: $350,000 - $616,000
4
Beds
3
Baths
2,492
Sq Ft
$189/Sq Ft
Est. Value
About This Home
This home is located at 25 3rd Ave, Isleton, CA 95641 and is currently estimated at $470,050, approximately $188 per square foot. 25 3rd Ave is a home located in Sacramento County with nearby schools including Isleton Elementary School, Riverview Middle School, and Rio Vista High School.
Ownership History
Date
Name
Owned For
Owner Type
Purchase Details
Closed on
Feb 23, 2009
Sold by
Parisi Michael and Parisi Guyla
Bought by
Moreland Edward J and Moreland Patricia
Current Estimated Value
Home Financials for this Owner
Home Financials are based on the most recent Mortgage that was taken out on this home.
Original Mortgage
$230,000
Outstanding Balance
$143,904
Interest Rate
4.91%
Mortgage Type
Seller Take Back
Estimated Equity
$326,146
Purchase Details
Closed on
Feb 20, 2003
Sold by
Golden Marjorie J
Bought by
Parisi Michael and Parisi Guyla
Purchase Details
Closed on
Oct 23, 2000
Sold by
Golden Marjorie J
Bought by
Golden Marjorie J
Purchase Details
Closed on
Oct 23, 1990
Sold by
Golden John E and Golden Marjorie J
Bought by
Golden John E and Golden Marjorie J
Create a Home Valuation Report for This Property
The Home Valuation Report is an in-depth analysis detailing your home's value as well as a comparison with similar homes in the area
Purchase History
| Date | Buyer | Sale Price | Title Company |
|---|---|---|---|
| Moreland Edward J | $260,000 | Fidelity National Title Co | |
| Parisi Michael | $275,000 | Placer Title Company | |
| Golden Marjorie J | -- | -- | |
| Golden John E | -- | -- |
Source: Public Records
Mortgage History
| Date | Status | Borrower | Loan Amount |
|---|---|---|---|
| Open | Moreland Edward J | $230,000 |
Source: Public Records
Tax History
| Year | Tax Paid | Tax Assessment Tax Assessment Total Assessment is a certain percentage of the fair market value that is determined by local assessors to be the total taxable value of land and additions on the property. | Land | Improvement |
|---|---|---|---|---|
| 2025 | $3,535 | $334,802 | $51,502 | $283,300 |
| 2024 | $3,535 | $328,239 | $50,493 | $277,746 |
| 2023 | $3,512 | $321,803 | $49,503 | $272,300 |
| 2022 | $3,453 | $315,494 | $48,533 | $266,961 |
| 2021 | $3,353 | $309,309 | $47,582 | $261,727 |
| 2020 | $3,213 | $306,139 | $47,095 | $259,044 |
| 2019 | $5,176 | $300,137 | $46,172 | $253,965 |
| 2018 | $5,246 | $294,253 | $45,267 | $248,986 |
| 2017 | $3,002 | $288,484 | $44,380 | $244,104 |
| 2016 | $2,951 | $282,828 | $43,510 | $239,318 |
| 2015 | $3,191 | $278,581 | $42,857 | $235,724 |
| 2014 | $2,919 | $273,125 | $42,018 | $231,107 |
Source: Public Records
Map
Nearby Homes
Your Personal Tour Guide
Ask me questions while you tour the home.