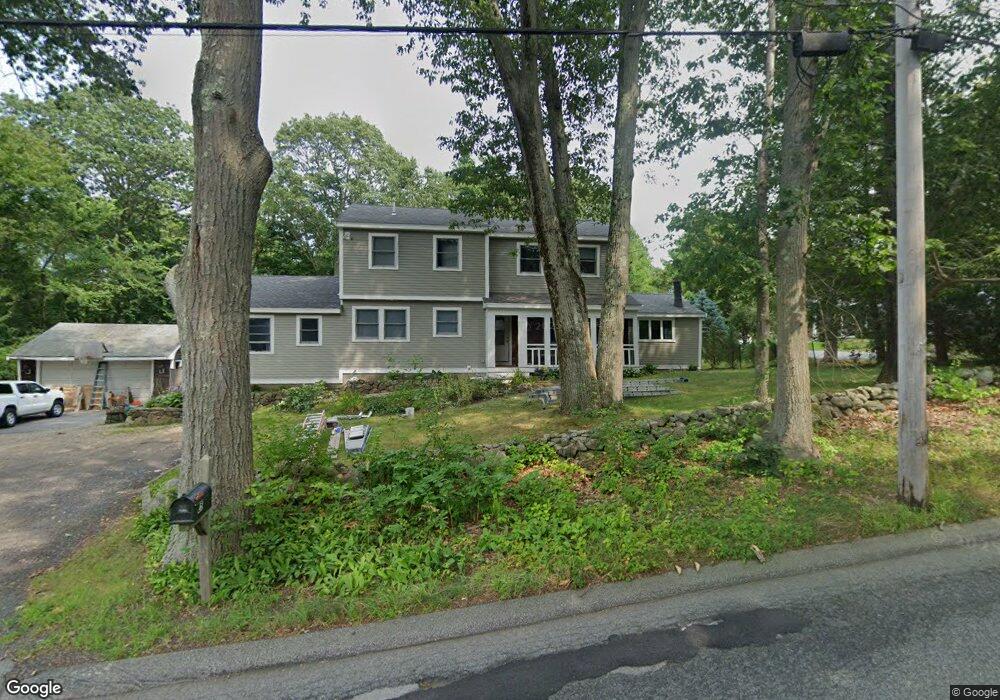
25 Burley St Wenham, MA 01984
Estimated Value: $849,000 - $1,111,000
4
Beds
3
Baths
2,551
Sq Ft
$373/Sq Ft
Est. Value
About This Home
This home is located at 25 Burley St, Wenham, MA 01984 and is currently estimated at $950,734, approximately $372 per square foot. 25 Burley St is a home located in Essex County with nearby schools including Winthrop School, Bessie Buker Elementary School, and Cutler Elementary School.
Ownership History
Date
Name
Owned For
Owner Type
Purchase Details
Closed on
Oct 24, 2025
Sold by
Mccabe Pamela and Nies Jay C
Bought by
Nies Mccabe Ft and Mccabe
Current Estimated Value
Purchase Details
Closed on
Dec 30, 1999
Sold by
25 Burley St Nt and Nies
Bought by
Nies Jay and Mccabe Pamela
Home Financials for this Owner
Home Financials are based on the most recent Mortgage that was taken out on this home.
Original Mortgage
$150,000
Interest Rate
7.71%
Mortgage Type
Purchase Money Mortgage
Create a Home Valuation Report for This Property
The Home Valuation Report is an in-depth analysis detailing your home's value as well as a comparison with similar homes in the area
Home Values in the Area
Average Home Value in this Area
Purchase History
We collect this data history from publicly available records. To have your information removed, we recommend requesting removal directly through your county’s website.
| Date | Buyer | Sale Price | Title Company |
|---|---|---|---|
| Nies Mccabe Ft | -- | -- | |
| Nies Jay | $187,500 | -- | |
| Nies Jay C | $187,500 | -- |
Source: Public Records
Mortgage History
We collect this data history from publicly available records. To have your information removed, we recommend requesting removal directly through your county’s website.
| Date | Status | Borrower | Loan Amount |
|---|---|---|---|
| Previous Owner | Nies Jay C | $250,000 | |
| Previous Owner | Nies Jay C | $200,000 | |
| Previous Owner | Nies Jay C | $150,000 |
Source: Public Records
Tax History
| Year | Tax Paid | Tax Assessment Tax Assessment Total Assessment is a certain percentage of the fair market value that is determined by local assessors to be the total taxable value of land and additions on the property. | Land | Improvement |
|---|---|---|---|---|
| 2025 | $11,736 | $755,200 | $412,400 | $342,800 |
| 2024 | $11,432 | $730,000 | $412,400 | $317,600 |
| 2023 | $13,441 | $774,700 | $427,600 | $347,100 |
| 2022 | $10,360 | $529,100 | $282,600 | $246,500 |
| 2021 | $9,923 | $504,200 | $257,700 | $246,500 |
| 2020 | $9,567 | $505,100 | $257,500 | $247,600 |
| 2019 | $9,102 | $505,100 | $257,500 | $247,600 |
| 2018 | $8,369 | $445,400 | $264,000 | $181,400 |
| 2017 | $8,155 | $444,900 | $264,000 | $180,900 |
| 2016 | $7,554 | $444,900 | $264,000 | $180,900 |
| 2015 | $7,230 | $444,900 | $264,000 | $180,900 |
Source: Public Records
Map
Nearby Homes
- 103 Wenham St
- 37 Princeton St
- 12 Wildwood Rd
- 4 Enon Rd
- 14 Huron Ave
- 19 Bridle Spur Ln
- 134 North St
- 53 Summer St
- 180 Conant Conant St
- 200 North St
- 200 North St Unit 23-B
- 29 Conant St
- 13 Douglas Ave
- 64 Amherst Rd
- 4 Alden St Unit 3
- 320 Newbury St Unit 902
- 40 Lake Dr
- 14 Lake Dr
- 8 Putnam St Unit 3
- 40 Village Rd Unit 1006
Your Personal Tour Guide
Ask me questions while you tour the home.