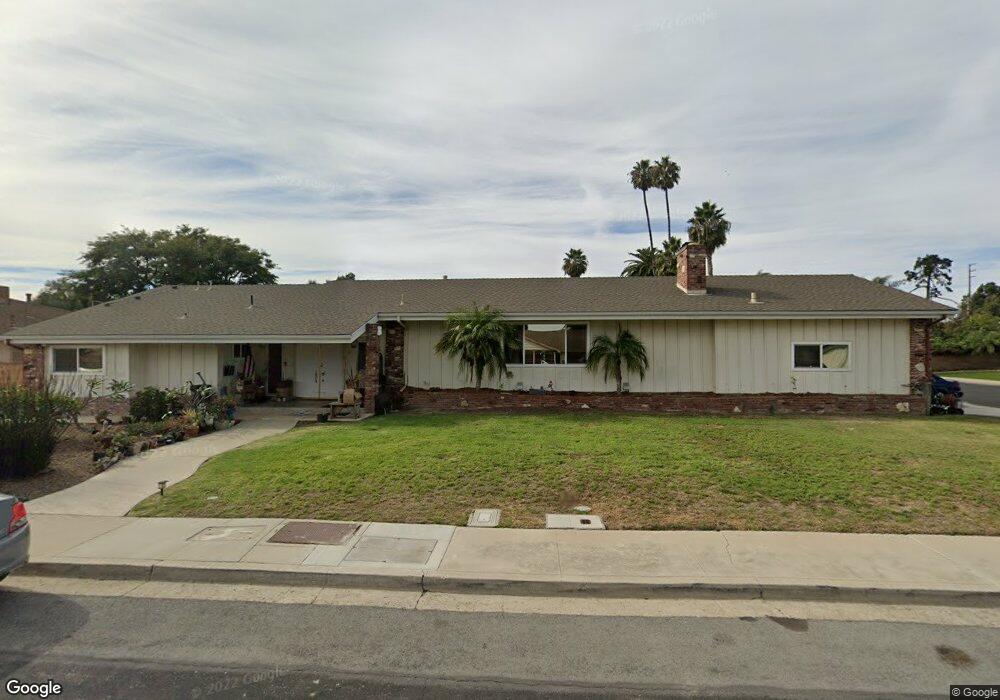
25 Carriage Square Oxnard, CA 93030
Carriage Square NeighborhoodEstimated Value: $891,000 - $1,149,000
5
Beds
3
Baths
3,529
Sq Ft
$297/Sq Ft
Est. Value
About This Home
This home is located at 25 Carriage Square, Oxnard, CA 93030 and is currently estimated at $1,048,465, approximately $297 per square foot. 25 Carriage Square is a home located in Ventura County with nearby schools including Sierra Linda Elementary School, Pacifica High School, and Vista Real Charter High School.
Ownership History
Date
Name
Owned For
Owner Type
Purchase Details
Closed on
Apr 9, 2021
Sold by
Barber Johnnie L and Barber Johnnie
Bought by
Barber Johnnie L and Barber Barber Ii Separate Propert J
Current Estimated Value
Home Financials for this Owner
Home Financials are based on the most recent Mortgage that was taken out on this home.
Original Mortgage
$300,000
Outstanding Balance
$225,194
Interest Rate
3%
Mortgage Type
New Conventional
Estimated Equity
$823,271
Purchase Details
Closed on
May 24, 2013
Sold by
Barber Johnnie L
Bought by
Barber Ii Johnnie L
Home Financials for this Owner
Home Financials are based on the most recent Mortgage that was taken out on this home.
Original Mortgage
$374,021
Interest Rate
3.38%
Mortgage Type
New Conventional
Purchase Details
Closed on
Jun 15, 2012
Sold by
Barber Johnnie L
Bought by
Barber Ii Johnnie L
Home Financials for this Owner
Home Financials are based on the most recent Mortgage that was taken out on this home.
Original Mortgage
$326,000
Interest Rate
3.77%
Mortgage Type
New Conventional
Purchase Details
Closed on
Aug 25, 2010
Sold by
Barber Johnnie L
Bought by
Barber Ii Johnnie L
Home Financials for this Owner
Home Financials are based on the most recent Mortgage that was taken out on this home.
Original Mortgage
$356,000
Interest Rate
4.02%
Mortgage Type
New Conventional
Purchase Details
Closed on
May 14, 2008
Sold by
Barber Johnnie L
Bought by
Barber Ii Johnnie L
Purchase Details
Closed on
Jan 13, 2005
Sold by
Barber John L
Bought by
Barber Ii Johnnie L
Home Financials for this Owner
Home Financials are based on the most recent Mortgage that was taken out on this home.
Original Mortgage
$549,500
Interest Rate
5.74%
Mortgage Type
New Conventional
Purchase Details
Closed on
Aug 15, 2003
Sold by
Barber Johnnie L
Bought by
Barber Ii Johnnie L
Home Financials for this Owner
Home Financials are based on the most recent Mortgage that was taken out on this home.
Original Mortgage
$200,000
Interest Rate
4.78%
Mortgage Type
Purchase Money Mortgage
Purchase Details
Closed on
Mar 7, 2000
Sold by
Barber Johnnie L Family and Johnnie L
Bought by
Barber Ii Johnnie L
Purchase Details
Closed on
Dec 12, 1995
Sold by
Barber Gloria K
Bought by
Barber Ii Johnnie L
Create a Home Valuation Report for This Property
The Home Valuation Report is an in-depth analysis detailing your home's value as well as a comparison with similar homes in the area
Home Values in the Area
Average Home Value in this Area
Purchase History
| Date | Buyer | Sale Price | Title Company |
|---|---|---|---|
| Barber Johnnie L | -- | Unisource | |
| Barber Johnnie L | -- | Unisource | |
| Barber Ii Johnnie L | -- | First American Title Co | |
| Barber Ii Johnnie L | -- | First American Title Company | |
| Barber Ii Johnnie L | -- | Lawyers Title | |
| Barber Ii Johnnie L | -- | Lawyers Title | |
| Barber Ii Johnnie L | -- | Accommodation | |
| Barber Ii Johnnie L | -- | Chicago Title Company | |
| Barber Ii Johnnie L | -- | None Available | |
| Barber Ii Johnnie L | -- | None Available | |
| Barber Ii Johnnie L | -- | Chicago Title Co | |
| Barber Ii John L | -- | Chicago Title Co | |
| Barber Ii Johnnie L | -- | Lawyers Title Company | |
| Barber Ii Johnnie L | -- | -- | |
| Barber Ii Johnnie L | -- | -- | |
| Barber Ii Johnnie L | -- | -- | |
| Barber Gloria K | -- | -- |
Source: Public Records
Mortgage History
| Date | Status | Borrower | Loan Amount |
|---|---|---|---|
| Open | Barber Johnnie L | $300,000 | |
| Closed | Barber Ii Johnnie L | $374,021 | |
| Closed | Barber Ii Johnnie L | $326,000 | |
| Closed | Barber Ii Johnnie L | $356,000 | |
| Closed | Barber Ii John L | $549,500 | |
| Closed | Barber Ii Johnnie L | $200,000 |
Source: Public Records
Tax History
| Year | Tax Paid | Tax Assessment Tax Assessment Total Assessment is a certain percentage of the fair market value that is determined by local assessors to be the total taxable value of land and additions on the property. | Land | Improvement |
|---|---|---|---|---|
| 2025 | $1,852 | $155,562 | $31,814 | $123,748 |
| 2024 | $1,852 | $152,512 | $31,190 | $121,322 |
| 2023 | $1,785 | $149,522 | $30,578 | $118,944 |
| 2022 | $1,731 | $146,591 | $29,979 | $116,612 |
| 2021 | $1,716 | $143,717 | $29,391 | $114,326 |
| 2020 | $1,746 | $142,245 | $29,091 | $113,154 |
| 2019 | $1,696 | $139,457 | $28,521 | $110,936 |
| 2018 | $1,671 | $136,723 | $27,962 | $108,761 |
| 2017 | $1,587 | $134,043 | $27,414 | $106,629 |
| 2016 | $1,531 | $131,416 | $26,877 | $104,539 |
| 2015 | $1,546 | $129,444 | $26,474 | $102,970 |
| 2014 | $1,528 | $126,910 | $25,956 | $100,954 |
Source: Public Records
Map
Nearby Homes
- 2005 Blackberry Cir
- 2016 Blackberry Cir
- 2041 Blackberry Cir
- 620 W Gonzales Rd
- 620 W Gonzales Rd Unit B
- 620 W Gonzales Rd Unit C
- 620 W Gonzales Rd Unit D
- 620 W Gonzales Rd Unit A
- 2160 Blackberry Cir
- 650 Bluebell Place
- 729 Ivywood Dr
- 411 Eastwood Dr
- 209 Lafayette Dr
- 2225 Edelweiss St Unit 43
- 1010 Janetwood Dr
- 715 W Robert Ave
- 550 Holly Ave
- 255 Douglas Ave
- 722 W Robert Ave
- 800 S A St
- 27 Carriage Square
- 15 Carriage Square
- 13 Carriage Square
- 22 Carriage Square
- 28 Carriage Square
- 30 Carriage Square
- 24 Carriage Square
- 26 Carriage Square
- 29 Carriage Square
- 32 Carriage Square
- 11 Carriage Square
- 14 Carriage Square
- 16 Carriage Square
- 12 Carriage Square
- 31 Carriage Square
- 34 Carriage Square
- 40 W Gonzales Rd
- 1825 N Oxnard Blvd
- 9 Carriage Square
- 10 Carriage Square
Your Personal Tour Guide
Ask me questions while you tour the home.