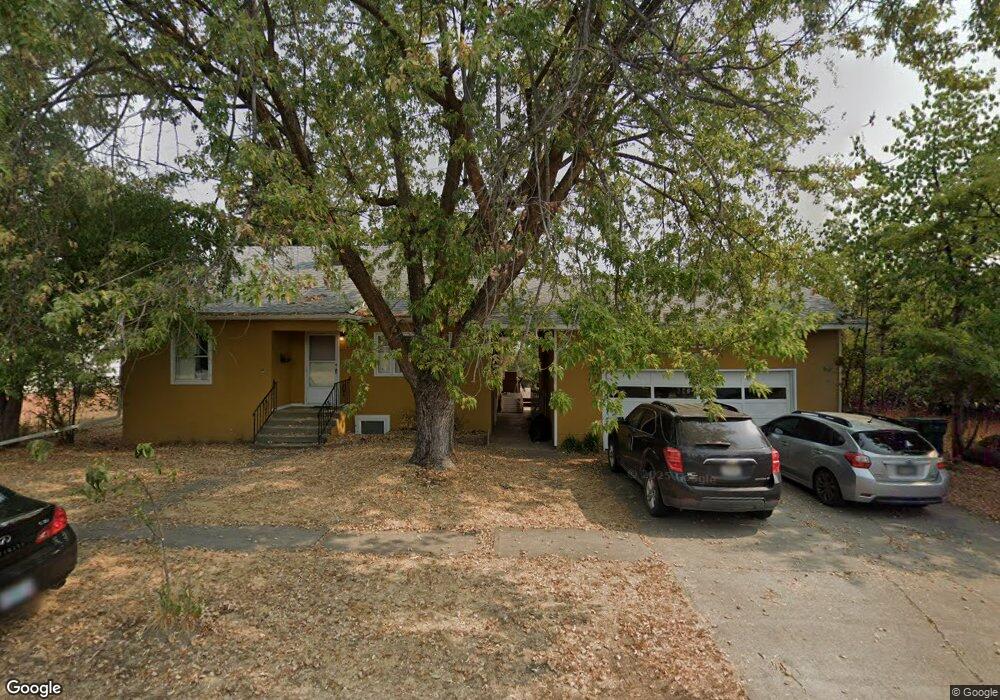
25 N 4th St Cheney, WA 99004
Estimated Value: $347,000 - $401,000
3
Beds
3
Baths
1,584
Sq Ft
$236/Sq Ft
Est. Value
About This Home
This home is located at 25 N 4th St, Cheney, WA 99004 and is currently estimated at $373,433, approximately $235 per square foot. 25 N 4th St is a home located in Spokane County with nearby schools including Betz Elementary School, Cheney Middle School, and Cheney High School.
Ownership History
Date
Name
Owned For
Owner Type
Purchase Details
Closed on
Aug 2, 2004
Sold by
Fredenberg Virgil G and Fredenberg Lori A
Bought by
Johnson Jonathan L and Howko Amy E
Current Estimated Value
Home Financials for this Owner
Home Financials are based on the most recent Mortgage that was taken out on this home.
Original Mortgage
$155,306
Outstanding Balance
$78,238
Interest Rate
6.24%
Mortgage Type
FHA
Estimated Equity
$295,195
Purchase Details
Closed on
May 26, 2000
Sold by
Greene William A and Greene Jean L
Bought by
Fredenberg Virgil G and Fredenberg Lori A
Home Financials for this Owner
Home Financials are based on the most recent Mortgage that was taken out on this home.
Original Mortgage
$104,545
Interest Rate
8.18%
Mortgage Type
VA
Create a Home Valuation Report for This Property
The Home Valuation Report is an in-depth analysis detailing your home's value as well as a comparison with similar homes in the area
Home Values in the Area
Average Home Value in this Area
Purchase History
| Date | Buyer | Sale Price | Title Company |
|---|---|---|---|
| Johnson Jonathan L | $157,500 | First American Title Ins | |
| Fredenberg Virgil G | $101,500 | Spokane County Title Co |
Source: Public Records
Mortgage History
| Date | Status | Borrower | Loan Amount |
|---|---|---|---|
| Open | Johnson Jonathan L | $155,306 | |
| Previous Owner | Fredenberg Virgil G | $104,545 |
Source: Public Records
Tax History Compared to Growth
Tax History
| Year | Tax Paid | Tax Assessment Tax Assessment Total Assessment is a certain percentage of the fair market value that is determined by local assessors to be the total taxable value of land and additions on the property. | Land | Improvement |
|---|---|---|---|---|
| 2025 | $3,320 | $317,700 | $70,000 | $247,700 |
| 2024 | $3,320 | $301,000 | $75,000 | $226,000 |
| 2023 | $2,524 | $301,000 | $75,000 | $226,000 |
| 2022 | $2,340 | $301,000 | $75,000 | $226,000 |
| 2021 | $2,317 | $202,400 | $31,500 | $170,900 |
| 2020 | $2,255 | $184,600 | $30,000 | $154,600 |
| 2019 | $1,963 | $169,100 | $28,000 | $141,100 |
| 2018 | $2,157 | $161,800 | $28,000 | $133,800 |
| 2017 | $1,936 | $160,400 | $28,000 | $132,400 |
| 2016 | $1,836 | $146,500 | $28,000 | $118,500 |
| 2015 | $1,610 | $130,600 | $28,000 | $102,600 |
| 2014 | -- | $130,600 | $28,000 | $102,600 |
| 2013 | -- | $0 | $0 | $0 |
Source: Public Records
Map
Nearby Homes