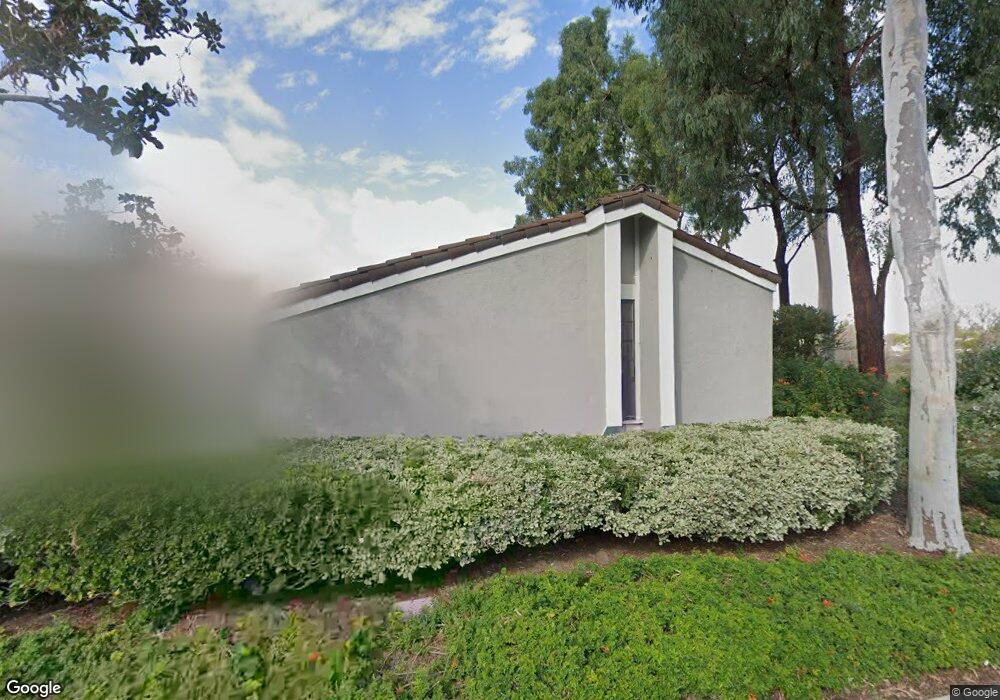
25 Rustling Wind Unit 19 Irvine, CA 92612
Turtle Rock NeighborhoodEstimated Value: $1,562,306 - $1,705,000
3
Beds
3
Baths
2,091
Sq Ft
$774/Sq Ft
Est. Value
About This Home
This home is located at 25 Rustling Wind Unit 19, Irvine, CA 92612 and is currently estimated at $1,617,577, approximately $773 per square foot. 25 Rustling Wind Unit 19 is a home located in Orange County with nearby schools including Turtle Rock Elementary, Rancho San Joaquin Middle School, and University High School.
Ownership History
Date
Name
Owned For
Owner Type
Purchase Details
Closed on
Sep 21, 2016
Sold by
Jones Robert L
Bought by
Jones Robert L
Current Estimated Value
Home Financials for this Owner
Home Financials are based on the most recent Mortgage that was taken out on this home.
Original Mortgage
$400,000
Outstanding Balance
$319,710
Interest Rate
3.45%
Mortgage Type
New Conventional
Estimated Equity
$1,297,867
Purchase Details
Closed on
Feb 26, 2013
Sold by
Jones Robert L
Bought by
Jones Robert L
Home Financials for this Owner
Home Financials are based on the most recent Mortgage that was taken out on this home.
Original Mortgage
$400,000
Interest Rate
3.34%
Mortgage Type
New Conventional
Purchase Details
Closed on
Feb 6, 2013
Sold by
Jones Robert L
Bought by
Jones Robert L
Home Financials for this Owner
Home Financials are based on the most recent Mortgage that was taken out on this home.
Original Mortgage
$400,000
Interest Rate
3.34%
Mortgage Type
New Conventional
Purchase Details
Closed on
Oct 25, 2012
Sold by
Jones Robert L and Jones Arlene P
Bought by
Jones Robert L
Purchase Details
Closed on
Jul 15, 2009
Sold by
Jones Robert L and Jones Arlene P
Bought by
Jones Robert L and Jones Arlene P
Purchase Details
Closed on
Jul 6, 2009
Sold by
Jones Robert L and Jones Arlene P
Bought by
Jones Robert L and Jones Arlene P
Purchase Details
Closed on
Nov 16, 2006
Sold by
Jones Robert L and Jones Arlene P
Bought by
Jones Robert L and Jones Arlene P
Purchase Details
Closed on
Jun 15, 2001
Sold by
Pellizzon Peter J and Pellizzon Pamela W
Bought by
Jones Robert L and Jones Arlene P
Home Financials for this Owner
Home Financials are based on the most recent Mortgage that was taken out on this home.
Original Mortgage
$440,550
Interest Rate
7.15%
Purchase Details
Closed on
Aug 12, 1998
Sold by
Pellizzon Peter J and Pellizzon Pamela W
Bought by
Pellizon Peter J and Pellizon Pamela W
Purchase Details
Closed on
Aug 20, 1993
Sold by
Pellizzon Peter J and Wright Pamela A
Bought by
Pellizzon Peter J and Pellizzon Pamela W
Home Financials for this Owner
Home Financials are based on the most recent Mortgage that was taken out on this home.
Original Mortgage
$10,000
Interest Rate
7.2%
Create a Home Valuation Report for This Property
The Home Valuation Report is an in-depth analysis detailing your home's value as well as a comparison with similar homes in the area
Home Values in the Area
Average Home Value in this Area
Purchase History
| Date | Buyer | Sale Price | Title Company |
|---|---|---|---|
| Jones Robert L | -- | Western Resources Title Co | |
| Jones Robert L | -- | Accommodation | |
| Jones Robert L | -- | First American Title Company | |
| Jones Robert L | -- | None Available | |
| Jones Robert L | -- | None Available | |
| Jones Robert L | -- | California Counties Title Co | |
| Jones Robert L | -- | None Available | |
| Jones Robert L | $489,500 | Chicago Title Co | |
| Pellizon Peter J | -- | -- | |
| Pellizzon Peter J | -- | First American Title Insuran |
Source: Public Records
Mortgage History
| Date | Status | Borrower | Loan Amount |
|---|---|---|---|
| Open | Jones Robert L | $400,000 | |
| Closed | Jones Robert L | $400,000 | |
| Closed | Jones Robert L | $440,550 | |
| Previous Owner | Pellizzon Peter J | $10,000 |
Source: Public Records
Tax History
| Year | Tax Paid | Tax Assessment Tax Assessment Total Assessment is a certain percentage of the fair market value that is determined by local assessors to be the total taxable value of land and additions on the property. | Land | Improvement |
|---|---|---|---|---|
| 2025 | $7,648 | $737,592 | $453,567 | $284,025 |
| 2024 | $7,648 | $723,130 | $444,674 | $278,456 |
| 2023 | $7,451 | $708,951 | $435,954 | $272,997 |
| 2022 | $7,316 | $695,050 | $427,405 | $267,645 |
| 2021 | $7,152 | $681,422 | $419,024 | $262,398 |
| 2020 | $7,110 | $674,435 | $414,727 | $259,708 |
| 2019 | $6,952 | $661,211 | $406,595 | $254,616 |
| 2018 | $6,828 | $648,247 | $398,623 | $249,624 |
| 2017 | $6,686 | $635,537 | $390,807 | $244,730 |
| 2016 | $6,387 | $623,076 | $383,144 | $239,932 |
| 2015 | $6,344 | $613,717 | $377,389 | $236,328 |
| 2014 | $6,221 | $601,696 | $369,997 | $231,699 |
Source: Public Records
Map
Nearby Homes
- 16 Rustling Wind
- 1 Misty Meadow
- 16 Charity
- 18 Broadleaf
- 2 Shasta
- 17682 Cassia Tree Ln
- 4985 Paseo de Vega
- 9 Teakwood
- 22 Meadowsweet Way
- 123 Willowbend
- 6 Mandrake Way
- 33 Mann St
- 4 Wellesley Unit 8
- 6 Banyan Tree
- 18802 Saginaw Dr
- 4181 Sandburg Way
- 16 Rana Unit 57
- 19 Palmento Way
- 18751 Via San Marco
- 26 Palmento Way
- 23 Rustling Wind
- 20 Rustling Wind Unit 20
- 20 Rustling Wind Unit 10
- 20 Rustling Wind
- 22 Rustling Wind Unit 11
- 19 Rustling Wind
- 15 Rustling Wind
- 36 Rustling Wind Unit 18
- 34 Rustling Wind Unit 17
- 34 Rustling Wind
- 30 Rustling Wind Unit 15
- 30 Rustling Wind
- 28 Rustling Wind Unit 14
- 18 Rustling Wind Unit 9
- 26 Rustling Wind
- 32 Rustling Wind Unit 16
- 24 Rustling Wind Unit 12
- 24 Rustling Wind
- 27 Valley View Unit 38
Your Personal Tour Guide
Ask me questions while you tour the home.