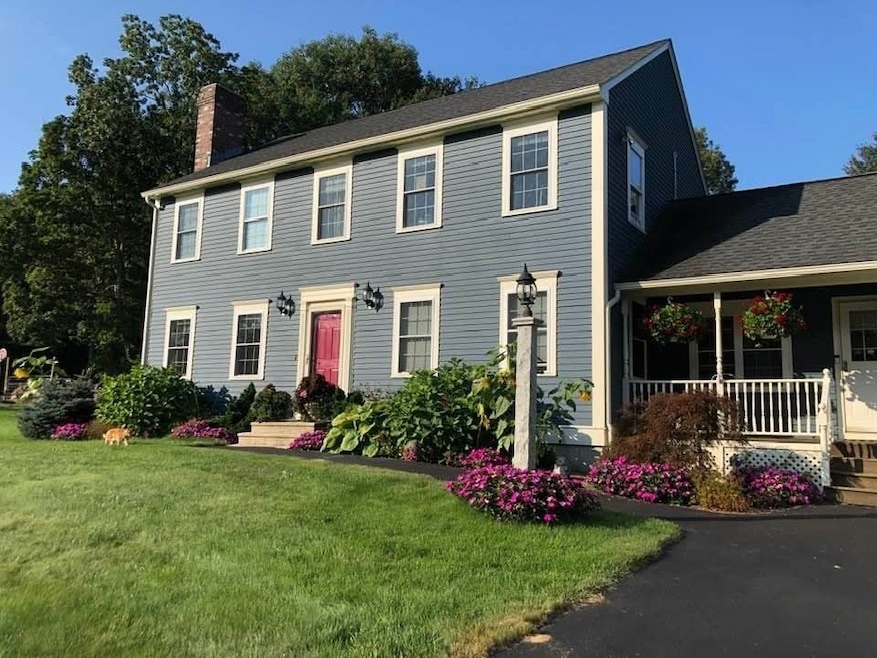
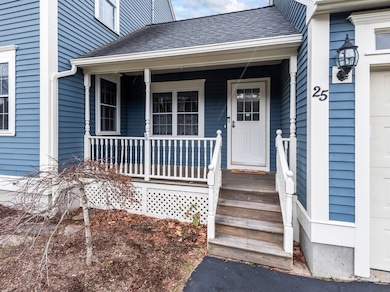
25 Watson Ln Rutland, MA 01543
Estimated payment $4,279/month
Highlights
- Above Ground Pool
- Solar Power System
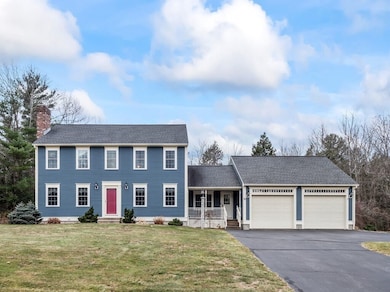
- Colonial Architecture
- Wachusett Regional High School Rated A-
- 2.22 Acre Lot
- Deck
About This Home
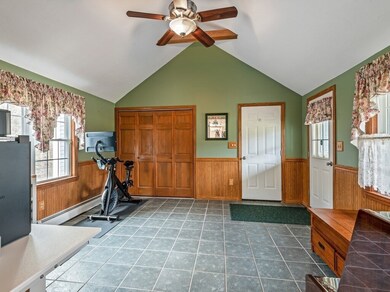
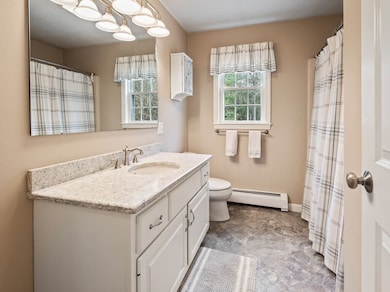
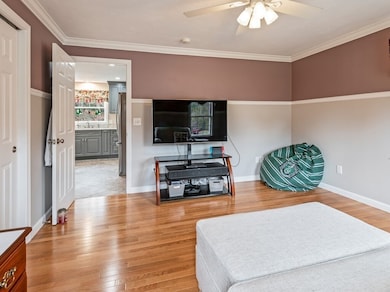
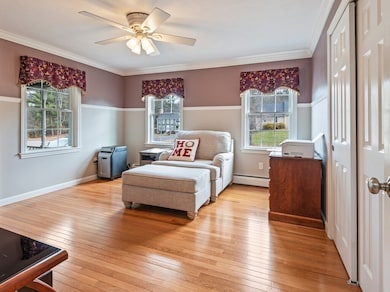
Discover the charm of this incredible home a short distance away from scenic walking trails. This property features, a modern kitchen with quartz countertops, first floor bedroom or formal dining room and a cozy living room with a fireplace. The bathrooms have updated flooring with a quartz countertop on 1st floor and marble countertops on the 2nd floor including a jetted tub. The roof was replaced in 2016, also the oversized garage plus the second floor addition was added in 2013. A mini split paired with a Buderus furnace for efficient heating and cooling with Solar Panels that are OWNED. The partially finished basement offers extra living space with ample storage. The surrounding 2+ acres along with the pool and deck provide a tranquil environment to enjoy.

Open House Schedule
-
Saturday, December 06, 202511:00 am to 12:30 pm12/6/2025 11:00:00 AM +00:0012/6/2025 12:30:00 PM +00:00Add to Calendar
-
Sunday, December 07, 202511:00 am to 12:30 pm12/7/2025 11:00:00 AM +00:0012/7/2025 12:30:00 PM +00:00Add to Calendar
Home Details
Home Type
- Single Family
Est. Annual Taxes
- $7,177
Year Built
- Built in 1992
Lot Details
- 2.22 Acre Lot
- Fenced Yard
- Sprinkler System
- Wooded Lot
- Property is zoned 1010
Parking
- 2 Car Attached Garage
- Oversized Parking
- Garage Door Opener
- Driveway
- Open Parking
- Off-Street Parking
Home Design
- Colonial Architecture
- Post and Beam
- Blown Fiberglass Insulation
- Blown-In Insulation
- Shingle Roof
- Concrete Perimeter Foundation
Interior Spaces
- Ceiling Fan
- Recessed Lighting
- Insulated Windows
- Sliding Doors
- Entrance Foyer
- Living Room with Fireplace
- Home Security System
- Attic
Kitchen
- Range
- Microwave
- Plumbed For Ice Maker
- Dishwasher
- Stainless Steel Appliances
- Kitchen Island
- Solid Surface Countertops
- Disposal
Flooring
- Wood
- Wall to Wall Carpet
- Laminate
- Marble
- Ceramic Tile
- Vinyl
Bedrooms and Bathrooms
- 4 Bedrooms
- Primary bedroom located on second floor
- Cedar Closet
- Linen Closet
- Walk-In Closet
- 2 Full Bathrooms
- Bathtub with Shower
- Linen Closet In Bathroom
Laundry
- Dryer
- Washer
Partially Finished Basement
- Basement Fills Entire Space Under The House
- Block Basement Construction
- Laundry in Basement
Eco-Friendly Details
- Solar Power System
- Solar Assisted Cooling System
Pool
- Above Ground Pool
- Spa
Outdoor Features
- Deck
- Outdoor Storage
- Rain Gutters
- Porch
Schools
- Naquag And Glenwood Elementary School
- Central Tree Middle Scool
- Wachusett Regional High School
Utilities
- Ductless Heating Or Cooling System
- Whole House Fan
- Central Air
- 3 Heating Zones
- Heating System Uses Oil
- Heat Pump System
- Baseboard Heating
- 100 Amp Service
- Water Treatment System
- Water Heater
- Internet Available
Listing and Financial Details
- Assessor Parcel Number M:42 B:C L:45,3740380
- Tax Block 45C
Community Details
Overview
- No Home Owners Association
- Near Conservation Area
Recreation
- Jogging Path
Map
Home Values in the Area
Average Home Value in this Area
Tax History
| Year | Tax Paid | Tax Assessment Tax Assessment Total Assessment is a certain percentage of the fair market value that is determined by local assessors to be the total taxable value of land and additions on the property. | Land | Improvement |
|---|---|---|---|---|
| 2025 | $7,177 | $504,000 | $133,600 | $370,400 |
| 2024 | $7,035 | $474,400 | $125,600 | $348,800 |
| 2023 | $6,477 | $472,100 | $118,500 | $353,600 |
| 2022 | $6,059 | $383,700 | $98,900 | $284,800 |
| 2021 | $6,065 | $363,200 | $107,100 | $256,100 |
| 2020 | $5,808 | $329,800 | $96,300 | $233,500 |
| 2019 | $5,625 | $314,400 | $83,500 | $230,900 |
| 2018 | $5,377 | $296,600 | $83,500 | $213,100 |
| 2017 | $5,436 | $296,700 | $83,500 | $213,200 |
| 2016 | $5,115 | $294,500 | $82,100 | $212,400 |
| 2015 | $5,058 | $286,600 | $82,100 | $204,500 |
| 2014 | $4,539 | $265,300 | $82,100 | $183,200 |
Property History
| Date | Event | Price | List to Sale | Price per Sq Ft |
|---|---|---|---|---|
| 12/02/2025 12/02/25 | For Sale | $699,000 | -- | $340 / Sq Ft |
Purchase History
| Date | Type | Sale Price | Title Company |
|---|---|---|---|
| Quit Claim Deed | -- | -- | |
| Deed | $138,800 | -- |
Mortgage History
| Date | Status | Loan Amount | Loan Type |
|---|---|---|---|
| Previous Owner | $201,600 | No Value Available | |
| Previous Owner | $25,000 | No Value Available | |
| Previous Owner | $32,000 | No Value Available |
Source: MLS Property Information Network (MLS PIN)
MLS Number: 73458881
APN: RUTL-000042-C000000-000045
Disclaimer: Certain information contained herein is derived from information provided by parties other than Homes.com. All information provided is deemed reliable, but is not guaranteed to be accurate and should be independently verified.
![]() The property listing data and information, or the Images, set forth herein were provided to MLS Property Information Network, Inc. from third party sources, including sellers, lessors and public records, and were compiled by MLS Property Information Network, Inc. The property listing data and information, and the Images, are for the personal, non-commercial use of consumers having a good faith interest in purchasing or leasing listed properties of the type displayed to them and may not be used for any purpose other than to identify prospective properties which such consumers may have a good faith interest in purchasing or leasing. MLS Property Information Network, Inc. and its subscribers disclaim any and all representations and warranties as to the accuracy of the property listing data and information, or as to the accuracy of any of the Images, set forth herein.
The property listing data and information, or the Images, set forth herein were provided to MLS Property Information Network, Inc. from third party sources, including sellers, lessors and public records, and were compiled by MLS Property Information Network, Inc. The property listing data and information, and the Images, are for the personal, non-commercial use of consumers having a good faith interest in purchasing or leasing listed properties of the type displayed to them and may not be used for any purpose other than to identify prospective properties which such consumers may have a good faith interest in purchasing or leasing. MLS Property Information Network, Inc. and its subscribers disclaim any and all representations and warranties as to the accuracy of the property listing data and information, or as to the accuracy of any of the Images, set forth herein.
- 55 Pommogussett Rd
- 32 Pommogussett Rd Unit 1
- 16 Richards Ave
- 28 Forest Hill Dr
- 11 Lewis St
- 21 Lewis St
- 27 Lewis St
- 12 Lewis St
- 6 Lewis St
- 10 Soucy Dr
- 2 Forest Hill Dr
- 21 Highland Park Rd
- 85 Maple Ave Unit A
- 40 Brunelle Dr
- 101 Brintnal Dr
- 73 Brintnal Dr
- 132 Fidelity Dr Unit 61
- 10 Fidelity Dr Unit 5
- 10 Beechwood Dr
- 7 Prescott St
- 249 Main St Unit 3-1
- 26 Glenwood Rd
- 263 Main St Unit 2
- 29 Highland Park Rd
- 84 Emerald Rd
- 281 Brooks Station Rd Unit 1
- 1665 Main St
- 129 Quinapoxet St
- 1252 Main St Unit 4D
- 1233 Main St Unit E
- 10 Fruit St Unit Fruit St.
- 48 Maple St Unit 2
- 17 Diamond Hill Unit B
- 67 Donald Ave
- 463 Bailey Rd Unit 1
- 20 Mountain Rd
- 134 Mountain Rd
- 931 Worcester Rd Unit 1
- 90 Central Park
- 1804 Oakwood St