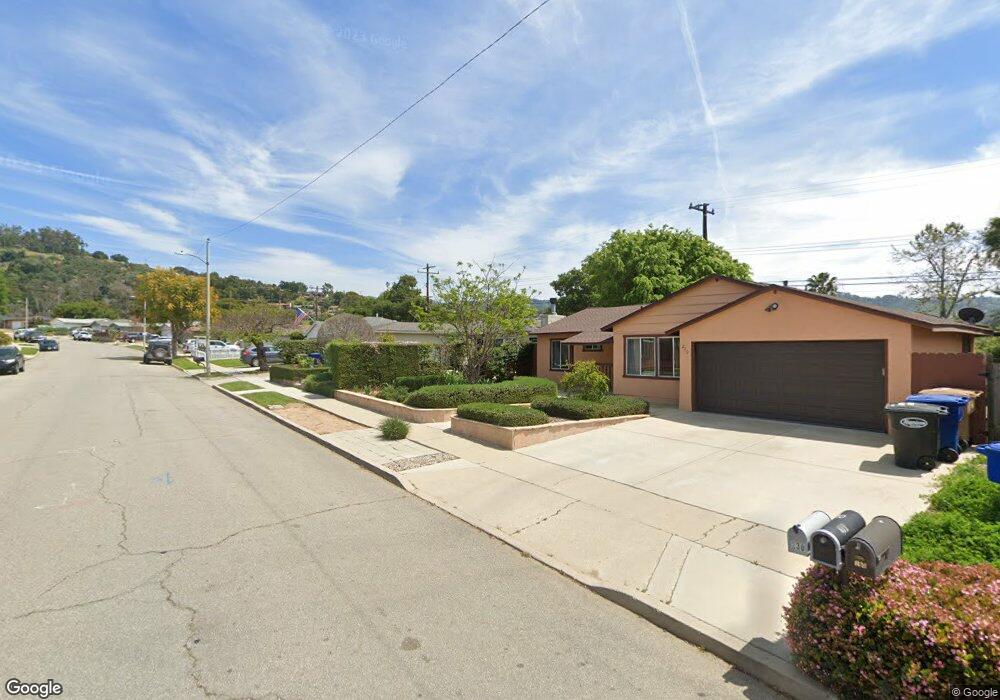
250 Monte Viaduct Oak View, CA 93022
Estimated Value: $696,000 - $871,000
3
Beds
2
Baths
1,098
Sq Ft
$719/Sq Ft
Est. Value
About This Home
This home is located at 250 Monte Viaduct, Oak View, CA 93022 and is currently estimated at $788,954, approximately $718 per square foot. 250 Monte Viaduct is a home located in Ventura County with nearby schools including Sunset Elementary School, De Anza Academy Of Technology And The Arts, and Ventura High School.
Ownership History
Date
Name
Owned For
Owner Type
Purchase Details
Closed on
Aug 8, 2014
Sold by
Mckee Madge M
Bought by
Mckee Madge Mcgrath and The Mckee Family Trust
Current Estimated Value
Purchase Details
Closed on
May 23, 2013
Sold by
Mckee William C
Bought by
Mckee Madge M
Purchase Details
Closed on
May 20, 2013
Sold by
Hamilton Marcia E
Bought by
Mckee Madge M
Purchase Details
Closed on
Aug 29, 2008
Sold by
Hsbc Bank Usa Na
Bought by
U S Bank Na and Wfmbs 2006-008
Home Financials for this Owner
Home Financials are based on the most recent Mortgage that was taken out on this home.
Original Mortgage
$15,000
Interest Rate
6.39%
Mortgage Type
Stand Alone Second
Purchase Details
Closed on
Aug 25, 2008
Sold by
U S Bank Na
Bought by
Hamilton Marcia E
Home Financials for this Owner
Home Financials are based on the most recent Mortgage that was taken out on this home.
Original Mortgage
$15,000
Interest Rate
6.39%
Mortgage Type
Stand Alone Second
Purchase Details
Closed on
Apr 11, 2008
Sold by
Guzman Joaquin and Guzman Alma
Bought by
Hsbc Bank Usa Na and Wfasc Mortgage Pass Through Certificates
Purchase Details
Closed on
Feb 6, 2005
Sold by
Tower Barney B and Tower Rosita D
Bought by
Guzman Joaquin and Guzman Alma
Home Financials for this Owner
Home Financials are based on the most recent Mortgage that was taken out on this home.
Original Mortgage
$412,000
Interest Rate
1%
Mortgage Type
New Conventional
Purchase Details
Closed on
Oct 25, 2000
Sold by
Wonsey Henry J
Bought by
Tower Barney B and Tower Rosita D
Home Financials for this Owner
Home Financials are based on the most recent Mortgage that was taken out on this home.
Original Mortgage
$191,200
Interest Rate
7.66%
Mortgage Type
Purchase Money Mortgage
Purchase Details
Closed on
Nov 9, 1993
Sold by
Diener Tim Bryan
Bought by
Wonsey Henry J
Home Financials for this Owner
Home Financials are based on the most recent Mortgage that was taken out on this home.
Original Mortgage
$138,720
Interest Rate
6.74%
Mortgage Type
Assumption
Create a Home Valuation Report for This Property
The Home Valuation Report is an in-depth analysis detailing your home's value as well as a comparison with similar homes in the area
Home Values in the Area
Average Home Value in this Area
Purchase History
| Date | Buyer | Sale Price | Title Company |
|---|---|---|---|
| Mckee Madge Mcgrath | -- | None Available | |
| Mckee Madge M | -- | Consumers Title Company | |
| Mckee Madge M | $430,000 | Consumers Title Company Of S | |
| U S Bank Na | $312,000 | California Title Company | |
| Hamilton Marcia E | $312,000 | California Title Company | |
| Hsbc Bank Usa Na | $371,250 | Accommodation | |
| Guzman Joaquin | $515,000 | First American Title Co | |
| Tower Barney B | $239,000 | Old Republic Title Company | |
| Wonsey Henry J | -- | Old Republic Title Company | |
| Wonsey Henry J | $136,000 | Fidelity National Title |
Source: Public Records
Mortgage History
| Date | Status | Borrower | Loan Amount |
|---|---|---|---|
| Previous Owner | U S Bank Na | $15,000 | |
| Previous Owner | Hamilton Marcia E | $280,800 | |
| Previous Owner | Guzman Joaquin | $412,000 | |
| Previous Owner | Wonsey Henry J | $191,200 | |
| Previous Owner | Wonsey Henry J | $138,720 | |
| Closed | Guzman Joaquin | $51,500 |
Source: Public Records
Tax History
| Year | Tax Paid | Tax Assessment Tax Assessment Total Assessment is a certain percentage of the fair market value that is determined by local assessors to be the total taxable value of land and additions on the property. | Land | Improvement |
|---|---|---|---|---|
| 2025 | $6,559 | $775,000 | $504,000 | $271,000 |
| 2024 | $6,559 | $519,116 | $207,645 | $311,471 |
| 2023 | $6,456 | $508,938 | $203,574 | $305,364 |
| 2022 | $6,079 | $498,959 | $199,582 | $299,377 |
| 2021 | $5,970 | $489,176 | $195,669 | $293,507 |
| 2020 | $5,903 | $484,162 | $193,663 | $290,499 |
| 2019 | $5,792 | $474,669 | $189,866 | $284,803 |
| 2018 | $5,690 | $465,363 | $186,144 | $279,219 |
| 2017 | $5,586 | $456,240 | $182,495 | $273,745 |
| 2016 | $5,491 | $447,295 | $178,917 | $268,378 |
| 2015 | $5,427 | $440,579 | $176,231 | $264,348 |
| 2014 | $5,337 | $431,951 | $172,780 | $259,171 |
Source: Public Records
Map
Nearby Homes
- 350 Riverside Rd
- 130 Olive St
- 1176 N Ventura Ave
- 182 Mountain View St
- 401 Burnham Rd
- 358 Sunset Ct
- 75 Maxine Ave
- 10980 N Ventura Ave
- 110 E Oak View Ave
- 0 2 Burnham Rd
- 10505 Dale Ave
- 10945 Alto Ct
- 65 Calle Vista Del Monte
- 10681 Encino Dr
- 543 Good Hope St
- 700 Thomas St
- 385 Sunset Ave
- 10542 Creek Rd
- 10522 Creek Rd
- 10562 Creek Rd
- 260 Monte Viaduct
- 230 Monte Viaduct
- 210 Monte Viaduct
- 270 Monte Viaduct
- 10 Rio Viaduct
- 265 Monte Viaduct
- 190 Monte Viaduct
- 280 Monte Viaduct
- 275 Monte Viaduct
- 30 Rio Viaduct
- 60 Rio Viaduct
- 195 Monte Viaduct
- 170 Monte Viaduct
- 290 Monte Viaduct
- 285 Monte Viaduct
- 80 Rio Viaduct
- 175 Monte Viaduct
- 500 Monte Viaduct
- 150 Monte Viaduct
- 295 Monte Viaduct
Your Personal Tour Guide
Ask me questions while you tour the home.