Estimated Value: $466,000 - $537,000
3
Beds
1
Bath
1,732
Sq Ft
$292/Sq Ft
Est. Value
About This Home
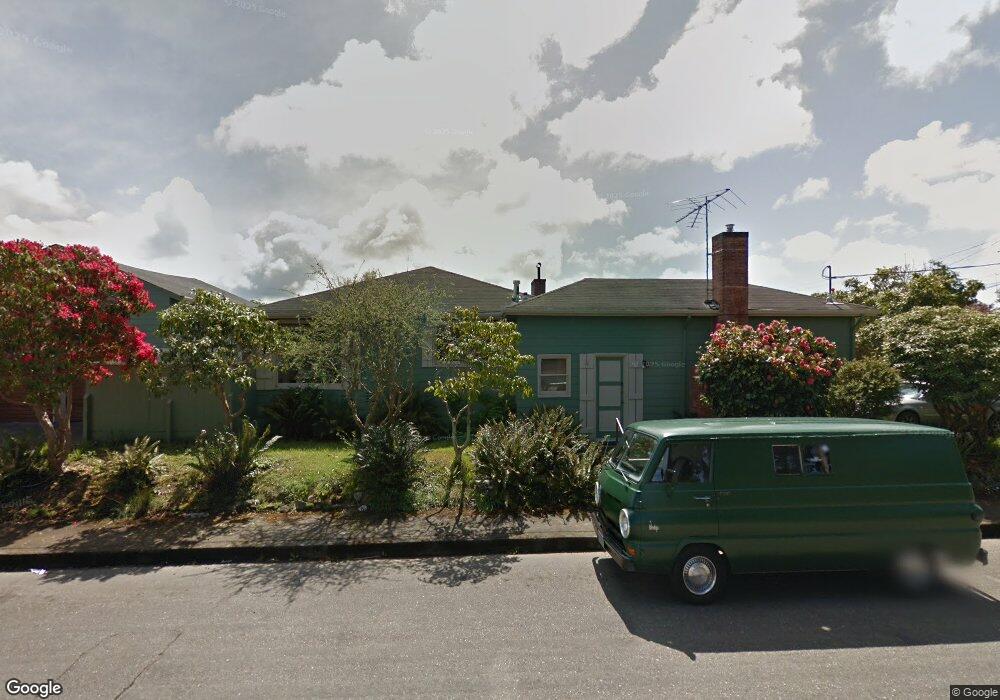
This home is located at 2505 N St, Eureka, CA 95501 and is currently estimated at $505,802, approximately $292 per square foot. 2505 N St is a home located in Humboldt County with nearby schools including Washington Elementary School, Catherine L. Zane Middle School, and Eureka Senior High School.
Ownership History
Date
Name
Owned For
Owner Type
Purchase Details
Closed on
Jan 4, 2006
Sold by
Cooper Curt A
Bought by
Held Kevin and Held Noreen
Current Estimated Value
Home Financials for this Owner
Home Financials are based on the most recent Mortgage that was taken out on this home.
Original Mortgage
$277,000
Outstanding Balance
$166,779
Interest Rate
7.5%
Mortgage Type
Fannie Mae Freddie Mac
Estimated Equity
$339,023
Purchase Details
Closed on
Sep 12, 1997
Sold by
Cooper Curt A and The 1992 G Arnold Cooper Revoc
Bought by
Cooper Curt A
Create a Home Valuation Report for This Property
The Home Valuation Report is an in-depth analysis detailing your home's value as well as a comparison with similar homes in the area
Home Values in the Area
Average Home Value in this Area
Purchase History
| Date | Buyer | Sale Price | Title Company |
|---|---|---|---|
| Held Kevin | $347,000 | Humboldt Land Title Co | |
| Cooper Curt A | -- | -- |
Source: Public Records
Mortgage History
| Date | Status | Borrower | Loan Amount |
|---|---|---|---|
| Open | Held Kevin | $277,000 |
Source: Public Records
Tax History
| Year | Tax Paid | Tax Assessment Tax Assessment Total Assessment is a certain percentage of the fair market value that is determined by local assessors to be the total taxable value of land and additions on the property. | Land | Improvement |
|---|---|---|---|---|
| 2025 | $4,803 | $474,182 | $136,646 | $337,536 |
| 2024 | $4,803 | $464,885 | $133,967 | $330,918 |
| 2023 | $3,038 | $295,000 | $110,000 | $185,000 |
| 2022 | $3,217 | $295,000 | $110,000 | $185,000 |
| 2021 | $3,073 | $295,000 | $110,000 | $185,000 |
| 2020 | $3,082 | $295,000 | $110,000 | $185,000 |
| 2019 | $3,079 | $260,000 | $100,000 | $160,000 |
| 2018 | $2,717 | $260,000 | $100,000 | $160,000 |
| 2017 | $2,758 | $260,000 | $100,000 | $160,000 |
| 2016 | $2,813 | $260,000 | $100,000 | $160,000 |
| 2015 | $2,831 | $260,000 | $100,000 | $160,000 |
| 2014 | $2,700 | $260,000 | $100,000 | $160,000 |
Source: Public Records
Map
Nearby Homes
Your Personal Tour Guide
Ask me questions while you tour the home.