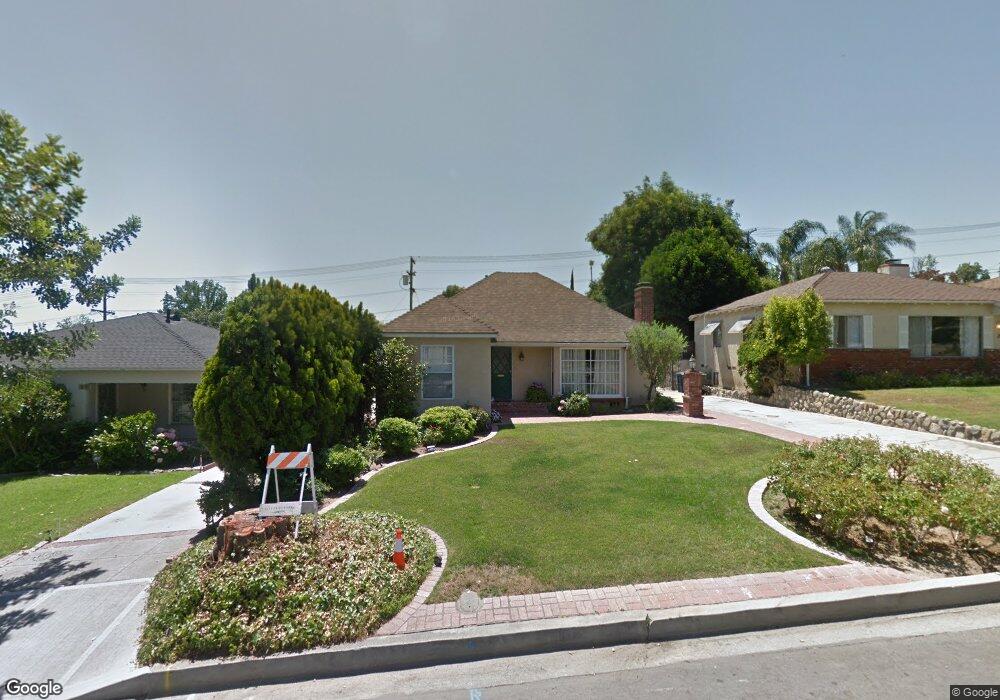
2509 N Parish Place Burbank, CA 91504
Hillside District NeighborhoodEstimated Value: $1,137,000 - $1,321,000
3
Beds
1
Bath
1,279
Sq Ft
$954/Sq Ft
Est. Value
About This Home
This home is located at 2509 N Parish Place, Burbank, CA 91504 and is currently estimated at $1,220,144, approximately $953 per square foot. 2509 N Parish Place is a home located in Los Angeles County with nearby schools including Thomas Jefferson Elementary School, John Muir Middle School, and Burbank High School.
Ownership History
Date
Name
Owned For
Owner Type
Purchase Details
Closed on
Sep 9, 2010
Sold by
Hunt Virginia L
Bought by
Hunt Virginia L and Hunt Family Trust
Current Estimated Value
Home Financials for this Owner
Home Financials are based on the most recent Mortgage that was taken out on this home.
Original Mortgage
$397,500
Outstanding Balance
$262,615
Interest Rate
4.45%
Mortgage Type
New Conventional
Estimated Equity
$957,529
Purchase Details
Closed on
Feb 20, 2003
Sold by
Hunt Maynard L
Bought by
Hunt Maynard L and Hunt Virginia L
Home Financials for this Owner
Home Financials are based on the most recent Mortgage that was taken out on this home.
Original Mortgage
$322,700
Interest Rate
5.89%
Purchase Details
Closed on
Jan 29, 2003
Sold by
Hunt Maynard L
Bought by
Hunt Maynard L and Hunt Virginia L
Home Financials for this Owner
Home Financials are based on the most recent Mortgage that was taken out on this home.
Original Mortgage
$322,700
Interest Rate
5.89%
Purchase Details
Closed on
Jan 12, 1999
Sold by
Hunt Maynard L
Bought by
Hunt Maynard L and Hunt Virginia L
Create a Home Valuation Report for This Property
The Home Valuation Report is an in-depth analysis detailing your home's value as well as a comparison with similar homes in the area
Home Values in the Area
Average Home Value in this Area
Purchase History
| Date | Buyer | Sale Price | Title Company |
|---|---|---|---|
| Hunt Virginia L | -- | None Available | |
| Hunt Virginia L | -- | Fidelity National Title Co | |
| Hunt Maynard L | -- | Chicago | |
| Hunt Maynard L | -- | Commonwealth Land Title Co | |
| Hunt Maynard L | -- | -- |
Source: Public Records
Mortgage History
| Date | Status | Borrower | Loan Amount |
|---|---|---|---|
| Open | Hunt Virginia L | $397,500 | |
| Previous Owner | Hunt Maynard L | $322,700 |
Source: Public Records
Tax History Compared to Growth
Tax History
| Year | Tax Paid | Tax Assessment Tax Assessment Total Assessment is a certain percentage of the fair market value that is determined by local assessors to be the total taxable value of land and additions on the property. | Land | Improvement |
|---|---|---|---|---|
| 2025 | $2,832 | $244,759 | $139,859 | $104,900 |
| 2024 | $2,832 | $239,961 | $137,117 | $102,844 |
| 2023 | $2,802 | $235,257 | $134,429 | $100,828 |
| 2022 | $2,679 | $230,645 | $131,794 | $98,851 |
| 2021 | $2,662 | $226,123 | $129,210 | $96,913 |
| 2019 | $2,558 | $219,419 | $125,379 | $94,040 |
| 2018 | $2,430 | $215,118 | $122,921 | $92,197 |
| 2016 | $2,501 | $225,579 | $118,149 | $107,430 |
| 2015 | $2,450 | $222,192 | $116,375 | $105,817 |
| 2014 | $2,451 | $217,841 | $114,096 | $103,745 |
Source: Public Records
Map
Nearby Homes
- 2528 N Orchard Dr
- 3141 Jolley Dr
- 2755 N Lincoln St
- 2420 N Keystone St
- 724 Price Dr
- 3032 Amigos Dr
- 2950 N Lincoln St
- 2615 Woodstock Ln
- 736 Irving Dr
- 3141 N Frederic St
- 2310 Washington Cir
- 3003 Mesa Verde Dr
- 3107 Highland View Dr
- 1809 Peyton Ave Unit 313
- 7754 Via Rosa Maria
- 2000 Peyton Ave
- 2014 Peyton Ave
- 7757 Via Rosa Maria
- 7727 Via Capri
- 906 Groton Dr
- 2505 N Parish Place
- 2513 N Parish Place
- 2501 N Parish Place
- 2519 N Parish Place
- 2508 N Lamer St
- 2504 N Lamer St
- 2514 N Lamer St
- 2451 N Parish Place
- 2523 N Parish Place
- 2500 N Lamer St
- 2518 N Lamer St
- 2510 N Parish Place
- 2504 N Parish Place
- 2516 N Parish Place
- 2450 N Lamer St
- 2447 N Parish Place
- 2500 N Parish Place
- 2522 N Lamer St
- 2527 N Parish Place
- 2520 N Parish Place