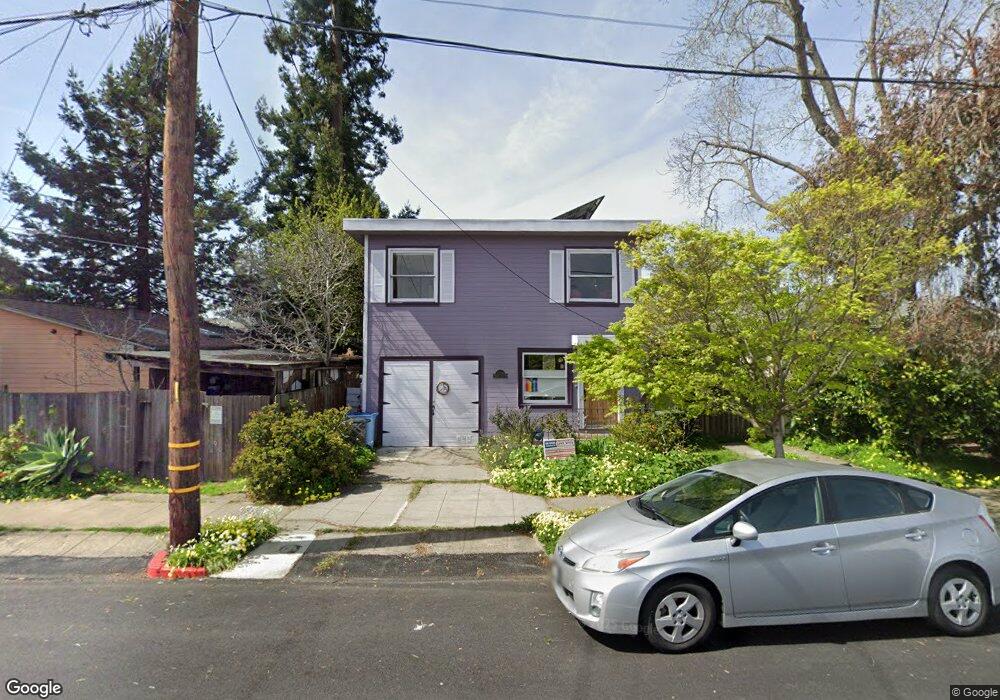
2514 Mabel St Berkeley, CA 94702
West Berkeley NeighborhoodEstimated Value: $1,247,486 - $1,526,000
3
Beds
1
Bath
1,512
Sq Ft
$909/Sq Ft
Est. Value
About This Home
This home is located at 2514 Mabel St, Berkeley, CA 94702 and is currently estimated at $1,374,372, approximately $908 per square foot. 2514 Mabel St is a home located in Alameda County with nearby schools including Oxford Elementary School, Washington Elementary School, and Malcolm X Elementary School.
Ownership History
Date
Name
Owned For
Owner Type
Purchase Details
Closed on
May 24, 2017
Sold by
Werfel Pearl and Kolenc Sheila
Bought by
Werfel Pearl and Kolenc Sheila
Current Estimated Value
Purchase Details
Closed on
Jul 1, 2004
Sold by
Denley Josephine
Bought by
Werfel Pearl and Werfel Kolene Sheila
Home Financials for this Owner
Home Financials are based on the most recent Mortgage that was taken out on this home.
Original Mortgage
$406,400
Outstanding Balance
$204,226
Interest Rate
6.31%
Mortgage Type
Purchase Money Mortgage
Estimated Equity
$1,170,146
Create a Home Valuation Report for This Property
The Home Valuation Report is an in-depth analysis detailing your home's value as well as a comparison with similar homes in the area
Home Values in the Area
Average Home Value in this Area
Purchase History
| Date | Buyer | Sale Price | Title Company |
|---|---|---|---|
| Werfel Pearl | -- | None Available | |
| Werfel Pearl | -- | None Available | |
| Werfel Pearl | $508,000 | Old Republic Title Company |
Source: Public Records
Mortgage History
| Date | Status | Borrower | Loan Amount |
|---|---|---|---|
| Open | Werfel Pearl | $406,400 | |
| Closed | Werfel Pearl | $76,200 |
Source: Public Records
Tax History
| Year | Tax Paid | Tax Assessment Tax Assessment Total Assessment is a certain percentage of the fair market value that is determined by local assessors to be the total taxable value of land and additions on the property. | Land | Improvement |
|---|---|---|---|---|
| 2025 | $11,325 | $701,040 | $212,412 | $495,628 |
| 2024 | $11,325 | $687,161 | $208,248 | $485,913 |
| 2023 | $11,083 | $680,551 | $204,165 | $476,386 |
| 2022 | $10,870 | $660,211 | $200,163 | $467,048 |
| 2021 | $10,886 | $647,130 | $196,239 | $457,891 |
| 2020 | $10,268 | $647,424 | $194,227 | $453,197 |
| 2019 | $9,827 | $634,735 | $190,420 | $444,315 |
| 2018 | $9,654 | $622,294 | $186,688 | $435,606 |
| 2017 | $9,307 | $610,097 | $183,029 | $427,068 |
| 2016 | $8,983 | $598,138 | $179,441 | $418,697 |
| 2015 | $8,860 | $589,157 | $176,747 | $412,410 |
| 2014 | $8,788 | $577,620 | $173,286 | $404,334 |
Source: Public Records
Map
Nearby Homes
- 1142 Dwight Way
- 1135 Parker St
- 1118 Dwight Way
- 2324 Browning St
- 2437 Acton St
- 2423 10th St
- 1039 Channing Way
- 2717 Mabel St
- 2327 10th St Unit 4
- 2231 Byron St
- 2350 Sacramento St
- 2341 9th St
- 2304 Edwards St
- 1524 Blake St
- 1034 Grayson St
- 1515 Derby St
- 1450 Ward St
- 2750 Sacramento St
- 917 Channing Way
- 2241 Ninth St
- 2510 Mabel St
- 1233 Blake St
- 1231 Blake St
- 1239 Blake St
- 1227 Blake St
- 1236 Dwight Way
- 1240 Dwight Way
- 1232 Dwight Way
- 1228 Dwight Way
- 1226 Dwight Way
- 1223 Blake St
- 1224 Dwight Way
- 1301 Blake St
- 1222 Dwight Way
- 1221 Blake St
- 2501 Mabel St Unit B
- 2501 Mabel St
- 2515 Mabel St
- 2511 Mabel St
- 1305 Blake St
Your Personal Tour Guide
Ask me questions while you tour the home.