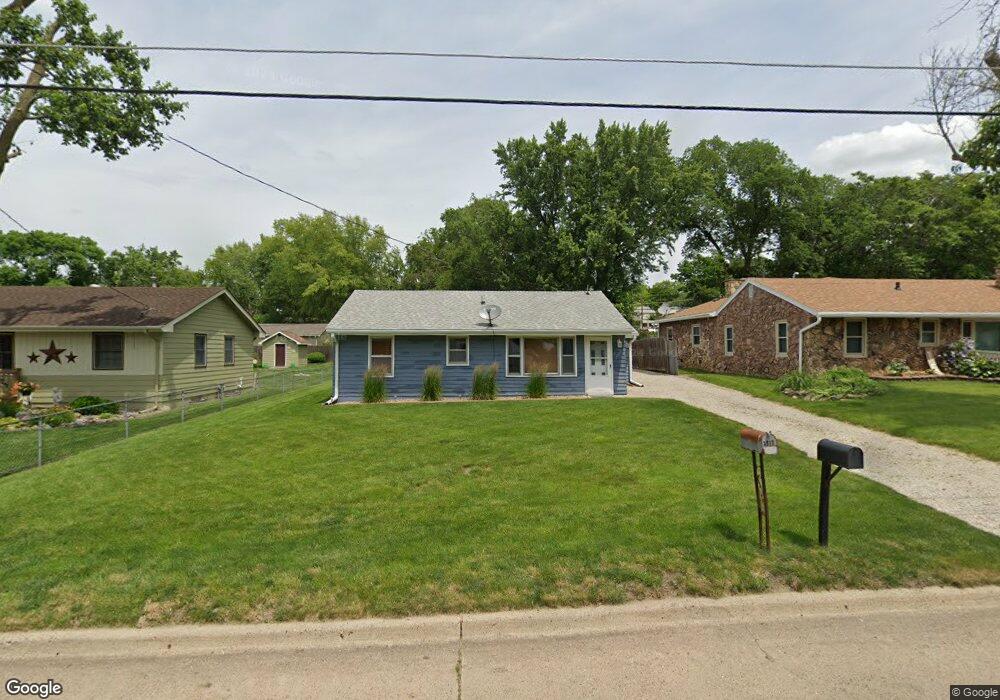
2516 E Sheridan Ave Des Moines, IA 50317
Fairmont Park NeighborhoodEstimated Value: $134,000 - $172,536
3
Beds
1
Bath
816
Sq Ft
$188/Sq Ft
Est. Value
About This Home
This home is located at 2516 E Sheridan Ave, Des Moines, IA 50317 and is currently estimated at $153,384, approximately $187 per square foot. 2516 E Sheridan Ave is a home located in Polk County with nearby schools including Garton Elementary School, Goodrell Middle School, and North High School.
Ownership History
Date
Name
Owned For
Owner Type
Purchase Details
Closed on
Sep 16, 2019
Sold by
Morrow Steven M
Bought by
Morrow Steven M and Morrow Kailie M
Current Estimated Value
Purchase Details
Closed on
Aug 24, 2006
Sold by
Tideback Craig
Bought by
Morrow Steven Michael
Home Financials for this Owner
Home Financials are based on the most recent Mortgage that was taken out on this home.
Original Mortgage
$17,200
Interest Rate
6.4%
Mortgage Type
Stand Alone Second
Purchase Details
Closed on
Feb 23, 2003
Sold by
Alexander Carl
Bought by
Tideback Craig
Home Financials for this Owner
Home Financials are based on the most recent Mortgage that was taken out on this home.
Original Mortgage
$73,000
Interest Rate
6.06%
Purchase Details
Closed on
Oct 4, 2002
Sold by
U S Bank Na
Bought by
Alexander Carl
Purchase Details
Closed on
Oct 24, 1999
Sold by
Smith Steven John and Smith Dawn Marie
Bought by
Kephart Michael P and Kephart Angela D
Home Financials for this Owner
Home Financials are based on the most recent Mortgage that was taken out on this home.
Original Mortgage
$59,655
Interest Rate
6.87%
Create a Home Valuation Report for This Property
The Home Valuation Report is an in-depth analysis detailing your home's value as well as a comparison with similar homes in the area
Home Values in the Area
Average Home Value in this Area
Purchase History
| Date | Buyer | Sale Price | Title Company |
|---|---|---|---|
| Morrow Steven M | -- | None Available | |
| Morrow Steven Michael | $85,500 | None Available | |
| Tideback Craig | $72,500 | -- | |
| Alexander Carl | $36,000 | -- | |
| Kephart Michael P | $61,000 | -- |
Source: Public Records
Mortgage History
| Date | Status | Borrower | Loan Amount |
|---|---|---|---|
| Closed | Morrow Steven Michael | $17,200 | |
| Open | Morrow Steven Michael | $68,800 | |
| Previous Owner | Tideback Craig | $73,000 | |
| Previous Owner | Kephart Michael P | $59,655 |
Source: Public Records
Tax History Compared to Growth
Tax History
| Year | Tax Paid | Tax Assessment Tax Assessment Total Assessment is a certain percentage of the fair market value that is determined by local assessors to be the total taxable value of land and additions on the property. | Land | Improvement |
|---|---|---|---|---|
| 2025 | $2,424 | $151,400 | $28,500 | $122,900 |
| 2024 | $2,424 | $133,700 | $24,800 | $108,900 |
| 2023 | $2,406 | $133,700 | $24,800 | $108,900 |
| 2022 | $2,386 | $111,000 | $21,400 | $89,600 |
| 2021 | $2,268 | $111,000 | $21,400 | $89,600 |
| 2020 | $2,352 | $99,500 | $19,100 | $80,400 |
| 2019 | $2,094 | $99,500 | $19,100 | $80,400 |
| 2018 | $2,066 | $86,400 | $16,300 | $70,100 |
| 2017 | $1,930 | $86,400 | $16,300 | $70,100 |
| 2016 | $1,876 | $79,900 | $14,800 | $65,100 |
| 2015 | $1,876 | $79,900 | $14,800 | $65,100 |
| 2014 | $1,974 | $86,000 | $15,600 | $70,400 |
Source: Public Records
Map
Nearby Homes
- 2633 Grandview Ave
- 2809 E 24th St
- 2503 E 24th St
- 2645 Wisconsin Ave
- 2323 E 23rd St
- 2718 Richmond Ave
- 2324 E 23rd St
- 2216 Lay St
- 2719 E Tiffin Ave
- 2680 Hull Ave
- 2407 E Tiffin Ave
- 2722 E Tiffin Ave
- 2622 E 29th St
- 2511 E Ovid Ave
- 3315 E 25th St
- 2817 Richmond Ave
- 2746 E Tiffin Ave
- 2114 Boyd St
- 2124 E 23rd St
- 2021 E 25th St
- 2512 E Sheridan Ave
- 2520 E Sheridan Ave
- 2506 E Sheridan Ave
- 2528 E Sheridan Ave
- 2515 Morton Ave
- 2519 Morton Ave
- 2511 Morton Ave
- 2523 Morton Ave
- 2603 E 25th St
- 2534 E Sheridan Ave
- 2517 E Sheridan Ave
- 2515 E Sheridan Ave
- 2505 Morton Ave
- 2531 Morton Ave
- 2513 E Sheridan Ave
- 2521 E Sheridan Ave
- 2527 E Sheridan Ave
- 2503 E Sheridan Ave
- 2501 Morton Ave
- 2533 Morton Ave