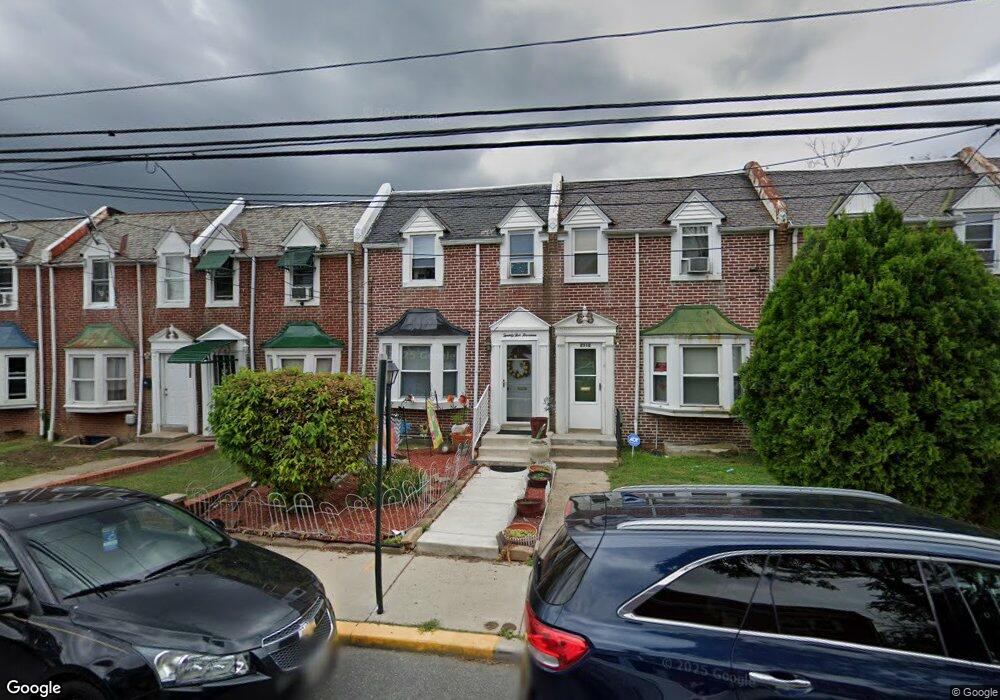
2516 Jessup St Wilmington, DE 19802
Eastlake NeighborhoodEstimated Value: $135,000 - $156,000
3
Beds
1
Bath
1,080
Sq Ft
$133/Sq Ft
Est. Value
About This Home
This home is located at 2516 Jessup St, Wilmington, DE 19802 and is currently estimated at $143,200, approximately $132 per square foot. 2516 Jessup St is a home located in New Castle County with nearby schools including Hanby Elementary School, Springer Middle School, and Mount Pleasant High School.
Ownership History
Date
Name
Owned For
Owner Type
Purchase Details
Closed on
Aug 30, 2006
Sold by
Ward Anthony L and Ward Stephanie I
Bought by
Bell Thomas P and Bell Claudette G
Current Estimated Value
Home Financials for this Owner
Home Financials are based on the most recent Mortgage that was taken out on this home.
Original Mortgage
$89,195
Outstanding Balance
$54,030
Interest Rate
6.83%
Mortgage Type
FHA
Estimated Equity
$89,170
Create a Home Valuation Report for This Property
The Home Valuation Report is an in-depth analysis detailing your home's value as well as a comparison with similar homes in the area
Home Values in the Area
Average Home Value in this Area
Purchase History
| Date | Buyer | Sale Price | Title Company |
|---|---|---|---|
| Bell Thomas P | $89,900 | None Available |
Source: Public Records
Mortgage History
| Date | Status | Borrower | Loan Amount |
|---|---|---|---|
| Open | Bell Thomas P | $89,195 |
Source: Public Records
Tax History Compared to Growth
Tax History
| Year | Tax Paid | Tax Assessment Tax Assessment Total Assessment is a certain percentage of the fair market value that is determined by local assessors to be the total taxable value of land and additions on the property. | Land | Improvement |
|---|---|---|---|---|
| 2024 | $714 | $22,100 | $2,400 | $19,700 |
| 2023 | $648 | $22,100 | $2,400 | $19,700 |
| 2022 | $655 | $22,100 | $2,400 | $19,700 |
| 2021 | $654 | $22,100 | $2,400 | $19,700 |
| 2020 | $655 | $22,100 | $2,400 | $19,700 |
| 2019 | $1,100 | $22,100 | $2,400 | $19,700 |
| 2018 | $634 | $22,100 | $2,400 | $19,700 |
| 2017 | $629 | $22,100 | $2,400 | $19,700 |
| 2016 | $629 | $22,100 | $2,400 | $19,700 |
| 2015 | $981 | $22,100 | $2,400 | $19,700 |
| 2014 | $980 | $22,100 | $2,400 | $19,700 |
Source: Public Records
Map
Nearby Homes