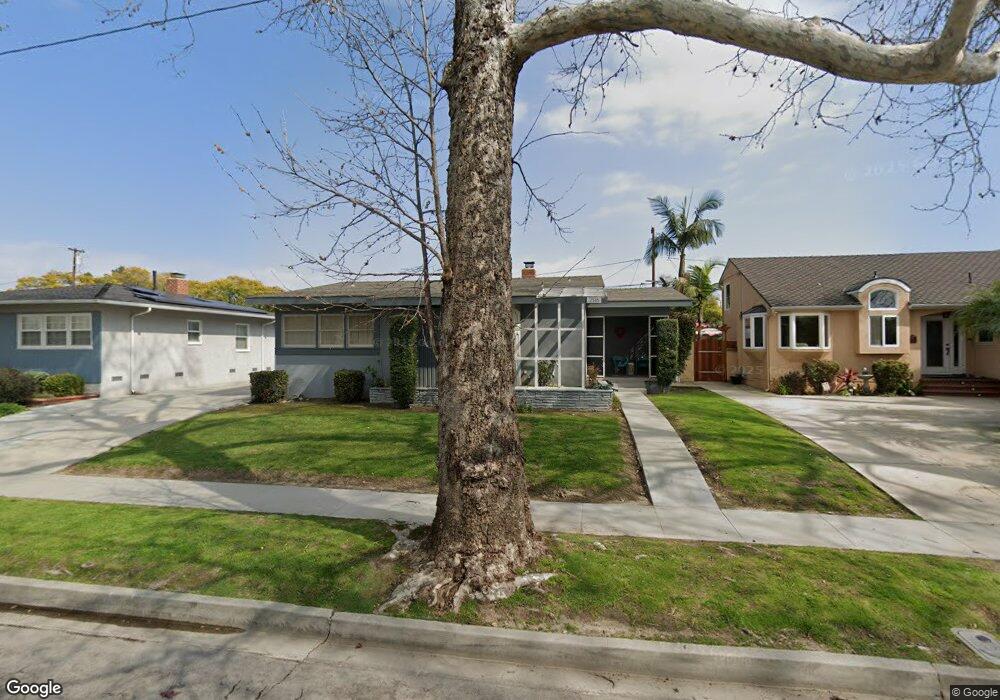
2518 Nipomo Ave Long Beach, CA 90815
El Dorado Park NeighborhoodEstimated Value: $1,014,274 - $1,055,000
3
Beds
2
Baths
1,218
Sq Ft
$843/Sq Ft
Est. Value
About This Home
This home is located at 2518 Nipomo Ave, Long Beach, CA 90815 and is currently estimated at $1,026,319, approximately $842 per square foot. 2518 Nipomo Ave is a home located in Los Angeles County with nearby schools including Stanford Middle School, Millikan High School, and Los Altos Grace Schools.
Ownership History
Date
Name
Owned For
Owner Type
Purchase Details
Closed on
Jul 22, 2024
Sold by
Rodriguez Diana C and Hines Marlene D
Bought by
Hines Marlene D and Hines Christina Rodriguez
Current Estimated Value
Purchase Details
Closed on
Jul 28, 2014
Sold by
Hasselman Karen D
Bought by
Hines Marlene D and Rodriguez Diana C
Home Financials for this Owner
Home Financials are based on the most recent Mortgage that was taken out on this home.
Original Mortgage
$416,000
Interest Rate
4.1%
Mortgage Type
New Conventional
Purchase Details
Closed on
Nov 20, 2013
Sold by
Gramling Bernard M
Bought by
Hasselman Karen D and Hasselman Richard
Purchase Details
Closed on
Jul 8, 2010
Sold by
Gramling Bernard Meade and Gramling Clara J
Bought by
Gramling Bernard M and Gramling Clara J
Create a Home Valuation Report for This Property
The Home Valuation Report is an in-depth analysis detailing your home's value as well as a comparison with similar homes in the area
Home Values in the Area
Average Home Value in this Area
Purchase History
| Date | Buyer | Sale Price | Title Company |
|---|---|---|---|
| Hines Marlene D | -- | None Listed On Document | |
| Hines Marlene D | $520,000 | Western Resources Title Co | |
| Hasselman Karen D | -- | None Available | |
| Gramling Bernard M | -- | None Available | |
| Gramling Bernard M | -- | None Available |
Source: Public Records
Mortgage History
| Date | Status | Borrower | Loan Amount |
|---|---|---|---|
| Previous Owner | Hines Marlene D | $416,000 |
Source: Public Records
Tax History Compared to Growth
Tax History
| Year | Tax Paid | Tax Assessment Tax Assessment Total Assessment is a certain percentage of the fair market value that is determined by local assessors to be the total taxable value of land and additions on the property. | Land | Improvement |
|---|---|---|---|---|
| 2025 | $8,028 | $624,952 | $499,965 | $124,987 |
| 2024 | $8,028 | $612,699 | $490,162 | $122,537 |
| 2023 | $7,901 | $600,686 | $480,551 | $120,135 |
| 2022 | $7,422 | $588,909 | $471,129 | $117,780 |
| 2021 | $11,778 | $577,363 | $461,892 | $115,471 |
| 2019 | $11,674 | $560,240 | $448,193 | $112,047 |
| 2018 | $11,417 | $549,255 | $439,405 | $109,850 |
| 2016 | $6,369 | $527,930 | $422,344 | $105,586 |
| 2015 | $6,112 | $520,000 | $416,000 | $104,000 |
| 2014 | $1,097 | $79,755 | $36,779 | $42,976 |
Source: Public Records
Map
Nearby Homes
- 2511 Nipomo Ave
- 2541 Ostrom Ave
- 2440 Ostrom Ave
- 2534 Petaluma Ave
- 2725 Ladoga Ave
- 6449 E Los Arcos St
- 2729 N Studebaker Rd
- 6361 E Deborah St
- 2137 Ostrom Ave
- 6241 E Vernon St
- 2154 Kallin Ave
- 2103 Roxanne Ave
- 2050 Josie Ave
- 2260 Tevis Ave
- 3032 Ostrom Ave
- 2541 Gondar Ave
- 2690 Senasac Ave
- 6948 E Los Santos Dr
- 2180 Mcnab Ave
- 1956 Volk Ave
- 2512 Nipomo Ave
- 2524 Nipomo Ave
- 2519 Ostrom Ave
- 2508 Nipomo Ave
- 2530 Nipomo Ave
- 2515 Ostrom Ave
- 2525 Ostrom Ave
- 2509 Ostrom Ave
- 2531 Ostrom Ave
- 2521 Nipomo Ave
- 2515 Nipomo Ave
- 2502 Nipomo Ave
- 2536 Nipomo Ave
- 2527 Nipomo Ave
- 2535 Ostrom Ave
- 2503 Ostrom Ave
- 2531 Nipomo Ave
- 2503 Nipomo Ave
- 2540 Nipomo Ave
- 2452 Nipomo Ave