D
Seller's Agent in 2025
Dustin Lyons
Realty ONE Group Summit
(805) 978-5764
1 in this area
8 Total Sales
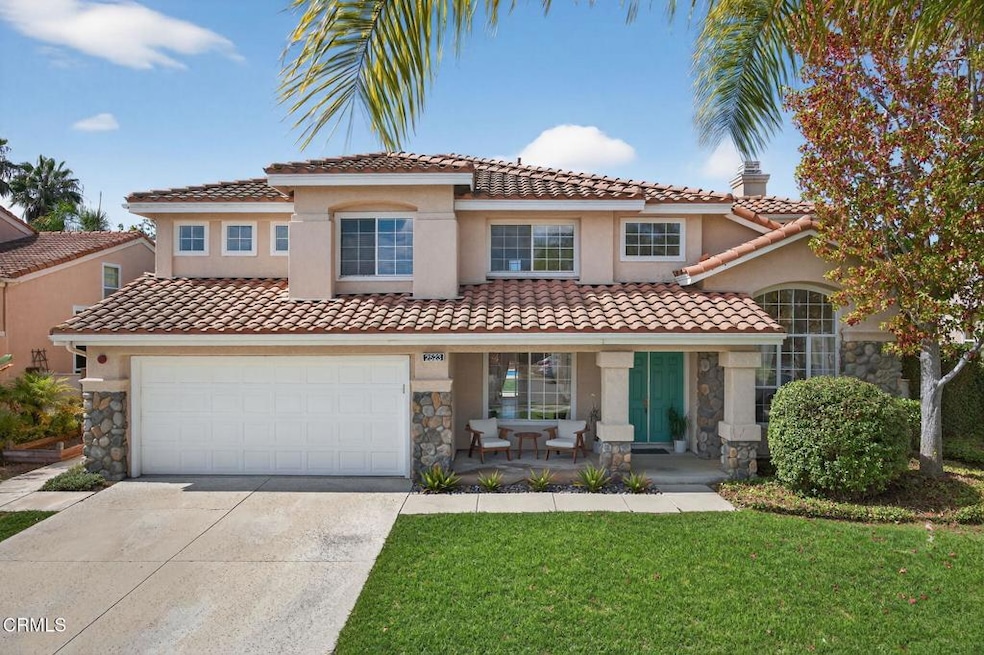
Welcome to this Gorgeous 3-bedroom, 2.5-bath family home with 3 car garage, nestled on a peaceful cul-de-sac. The spacious bonus room area can easily be converted into a 4th bedroom, offering flexibility for your needs. A large primary suite features a walk-in closet plus a second closet, and an extra-spacious ensuite bath. Enjoy a renovated kitchen, travertine tile floors downstairs, and plush carpet upstairs. Step outside to a sparkling blue pool and jacuzzi surrounded by an expansive and private backyard with a patio and built-in deck--perfect for entertaining. Just one block from a scenic park with walking paths and a playground, and only 10 minutes from the beach as well as Ventura and Channel Islands Harbors.
Last Agent to Sell the Property
Realty ONE Group Summit License #01793746 Listed on: 09/24/2025

| Date | Type | Sale Price | Title Company |
|---|---|---|---|
| Grant Deed | $1,055,000 | Fidelity National Title Compan | |
| Interfamily Deed Transfer | -- | None Available | |
| Interfamily Deed Transfer | -- | Lawyers Title Company |
| Date | Status | Loan Amount | Loan Type |
|---|---|---|---|
| Previous Owner | $197,000 | No Value Available |
| Date | Event | Price | List to Sale | Price per Sq Ft |
|---|---|---|---|---|
| 10/28/2025 10/28/25 | Sold | $1,055,000 | -3.0% | $481 / Sq Ft |
| 10/07/2025 10/07/25 | Pending | -- | -- | -- |
| 09/23/2025 09/23/25 | For Sale | $1,088,000 | -- | $496 / Sq Ft |
| Year | Tax Paid | Tax Assessment Tax Assessment Total Assessment is a certain percentage of the fair market value that is determined by local assessors to be the total taxable value of land and additions on the property. | Land | Improvement |
|---|---|---|---|---|
| 2025 | $4,250 | $356,954 | $135,433 | $221,521 |
| 2024 | $4,250 | $349,955 | $132,777 | $217,178 |
| 2023 | $4,048 | $343,094 | $130,174 | $212,920 |
| 2022 | $3,931 | $336,367 | $127,621 | $208,746 |
| 2021 | $4,037 | $329,772 | $125,119 | $204,653 |
| 2020 | $4,119 | $326,392 | $123,837 | $202,555 |
| 2019 | $3,956 | $319,993 | $121,409 | $198,584 |
| 2018 | $3,826 | $313,720 | $119,029 | $194,691 |
| 2017 | $3,727 | $307,570 | $116,696 | $190,874 |
| 2016 | $3,523 | $301,540 | $114,408 | $187,132 |
| 2015 | $3,626 | $297,013 | $112,691 | $184,322 |
| 2014 | $3,474 | $291,197 | $110,485 | $180,712 |
D
Seller's Agent in 2025
Dustin Lyons
Realty ONE Group Summit
(805) 978-5764
1 in this area
8 Total Sales
Buyer's Agent in 2025
Evan Remedios
RE/MAX
(805) 415-9650
1 in this area
53 Total Sales
Source: Ventura County Regional Data Share
MLS Number: V1-32507
APN: 140-0-041-205
Disclaimer: Certain information contained herein is derived from information provided by parties other than Homes.com. All information provided is deemed reliable, but is not guaranteed to be accurate and should be independently verified.
![]() IDX information is provided exclusively for personal, non-commercial use, and may not be used for any purpose other than to identify prospective properties consumers may be interested in purchasing. Information is deemed reliable but not guaranteed.
IDX information is provided exclusively for personal, non-commercial use, and may not be used for any purpose other than to identify prospective properties consumers may be interested in purchasing. Information is deemed reliable but not guaranteed.
Ask me questions while you tour the home.