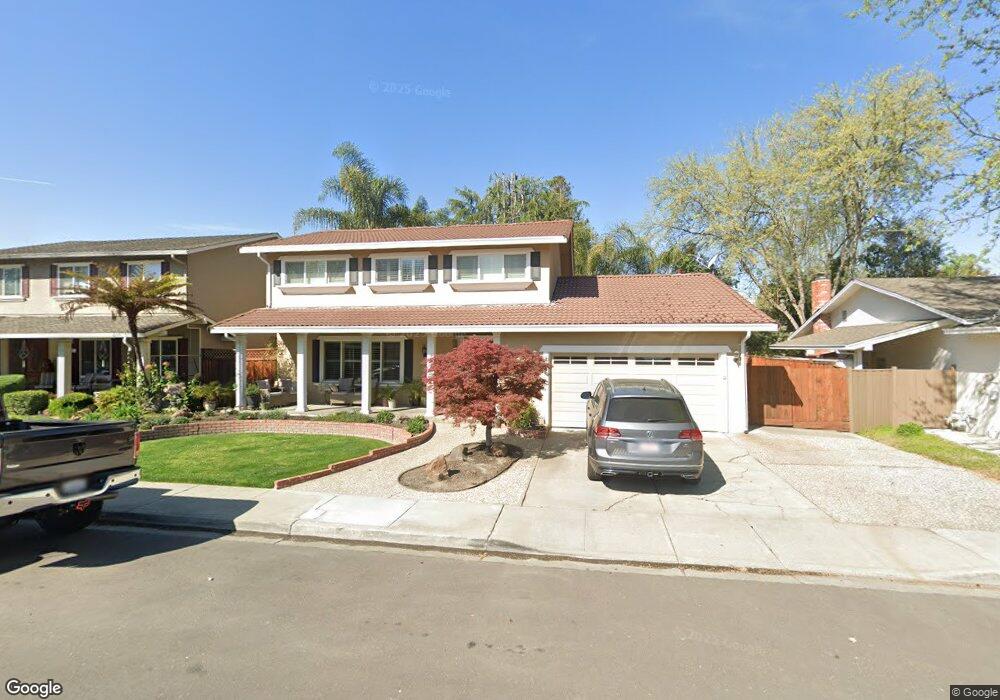
2523 Willowren Way Pleasanton, CA 94566
Amador Valley NeighborhoodEstimated Value: $1,774,240 - $2,052,000
4
Beds
3
Baths
2,106
Sq Ft
$899/Sq Ft
Est. Value
About This Home
This home is located at 2523 Willowren Way, Pleasanton, CA 94566 and is currently estimated at $1,892,310, approximately $898 per square foot. 2523 Willowren Way is a home located in Alameda County with nearby schools including Walnut Grove Elementary School, Harvest Park Middle School, and Amador Valley High School.
Ownership History
Date
Name
Owned For
Owner Type
Purchase Details
Closed on
Jul 11, 2022
Sold by
Glafkides Dennis J and Glafkides Stacie L
Bought by
Glafkides Trust
Current Estimated Value
Purchase Details
Closed on
Aug 4, 2015
Sold by
Glafkides Dennis Joseph and Glafkides Stacie Lynn
Bought by
Glafkides Dennis J and Glafkides Stacie L
Home Financials for this Owner
Home Financials are based on the most recent Mortgage that was taken out on this home.
Original Mortgage
$297,000
Interest Rate
3.98%
Mortgage Type
New Conventional
Purchase Details
Closed on
Apr 6, 2009
Sold by
Glafkides Dennis Joseph and Glafkides Stacie Lynn
Bought by
Glafkides Stacie Lynn and Glafkides Dennis Joseph
Home Financials for this Owner
Home Financials are based on the most recent Mortgage that was taken out on this home.
Original Mortgage
$210,000
Interest Rate
5.06%
Mortgage Type
New Conventional
Purchase Details
Closed on
Mar 5, 2004
Sold by
Glafkides Dennis J
Bought by
Glafkides Dennis J and Glafkides Stacie L
Purchase Details
Closed on
Nov 19, 2002
Sold by
Glafkides E Dennis and Glafkides Sylvia A
Bought by
Glafkides Dennis J
Purchase Details
Closed on
Dec 23, 1998
Sold by
Glafkides E Dennis and Glafkides Sylvia A
Bought by
Glafkides E Dennis and Glafkides Sylvia A
Purchase Details
Closed on
Jan 12, 1998
Sold by
Glafkides E Dennis and Glafkides Sylvia A
Bought by
Glafkides E Dennis and Glafkides Sylvia A
Purchase Details
Closed on
Dec 24, 1997
Sold by
Glafkides E Dennis and Glafkides Sylvia A
Bought by
Glafkides Dennis J
Purchase Details
Closed on
Dec 4, 1997
Sold by
Glafkides E Dennis and Glafkides Sylvia A
Bought by
Glafkides E Dennis and Glafkides Sylvia A
Purchase Details
Closed on
Dec 4, 1996
Sold by
Glafkides E Dennis and Glafkides Sylvia A
Bought by
Glafkides Dennis J
Purchase Details
Closed on
Mar 30, 1995
Sold by
Walker Kathleen Cooper
Bought by
Glafkides E Dennis and Glafkides Sylvia A
Home Financials for this Owner
Home Financials are based on the most recent Mortgage that was taken out on this home.
Original Mortgage
$217,600
Interest Rate
8.81%
Create a Home Valuation Report for This Property
The Home Valuation Report is an in-depth analysis detailing your home's value as well as a comparison with similar homes in the area
Home Values in the Area
Average Home Value in this Area
Purchase History
| Date | Buyer | Sale Price | Title Company |
|---|---|---|---|
| Glafkides Trust | -- | Horizon Elder Law & Estate Pla | |
| Glafkides Dennis J | -- | Old Republic Title Company | |
| Glafkides Stacie Lynn | -- | North American Title Company | |
| Glafkides Dennis J | -- | North American Title Company | |
| Glafkides Dennis J | -- | -- | |
| Glafkides E Dennis | -- | -- | |
| Glafkides E Dennis | -- | -- | |
| Glafkides E Dennis | -- | -- | |
| Glafkides E Dennis | -- | -- | |
| Glafkides Dennis J | -- | -- | |
| Glafkides E Dennis | -- | -- | |
| Glafkides Dennis J | -- | -- | |
| Glafkides E Dennis | $272,000 | Chicago Title Company |
Source: Public Records
Mortgage History
| Date | Status | Borrower | Loan Amount |
|---|---|---|---|
| Previous Owner | Glafkides Dennis J | $297,000 | |
| Previous Owner | Glafkides Stacie Lynn | $210,000 | |
| Previous Owner | Glafkides E Dennis | $217,600 |
Source: Public Records
Tax History
| Year | Tax Paid | Tax Assessment Tax Assessment Total Assessment is a certain percentage of the fair market value that is determined by local assessors to be the total taxable value of land and additions on the property. | Land | Improvement |
|---|---|---|---|---|
| 2025 | $5,251 | $449,853 | $137,056 | $319,797 |
| 2024 | $5,251 | $440,896 | $134,369 | $313,527 |
| 2023 | $5,188 | $439,116 | $131,735 | $307,381 |
| 2022 | $4,915 | $423,507 | $129,152 | $301,355 |
| 2021 | $4,788 | $415,067 | $126,620 | $295,447 |
| 2020 | $4,726 | $417,740 | $125,322 | $292,418 |
| 2019 | $4,781 | $409,550 | $122,865 | $286,685 |
| 2018 | $4,684 | $401,520 | $120,456 | $281,064 |
| 2017 | $4,564 | $393,648 | $118,094 | $275,554 |
| 2016 | $4,209 | $385,931 | $115,779 | $270,152 |
| 2015 | $4,130 | $380,135 | $114,040 | $266,095 |
| 2014 | $4,202 | $372,691 | $111,807 | $260,884 |
Source: Public Records
Map
Nearby Homes
- 3227 Harvey Ct
- 3259 Harvey Ct
- 1874 Harvest Rd
- 3254 Verde Ct
- 3080 Casadero Ct
- 4847 Golden Rd
- 5950 Via Del Cielo
- 5995 Via Del Cielo
- 3530 Carlsbad Ct
- 5111 Venice Ct
- 4563 Gatetree Cir
- 1135 Tiffany Ln
- 4178 Francisco St
- 6107 Homer Ct
- 6304 Singletree Way
- 2128 Alexander Way
- 3154 Pawnee Way
- 3162 Paseo Robles
- 4436 Del Valle Pkwy
- 2229 Delucchi Dr
- 2515 Willowren Way
- 5376 Mallard Dr
- 2679 Starling Ct
- 2539 Willowren Way
- 2520 Willowren Way
- 2528 Willowren Way
- 2512 Willowren Way
- 5380 Mallard Dr
- 2536 Willowren Way
- 2547 Willowren Way
- 2665 Starling Ct
- 2693 Starling Ct
- 5373 Mallard Dr
- 5369 Mallard Dr
- 5328 Mallard Dr
- 5377 Mallard Dr
- 5357 Mallard Dr
- 5384 Mallard Dr
- 2544 Willowren Way
- 2430 Crestline Rd