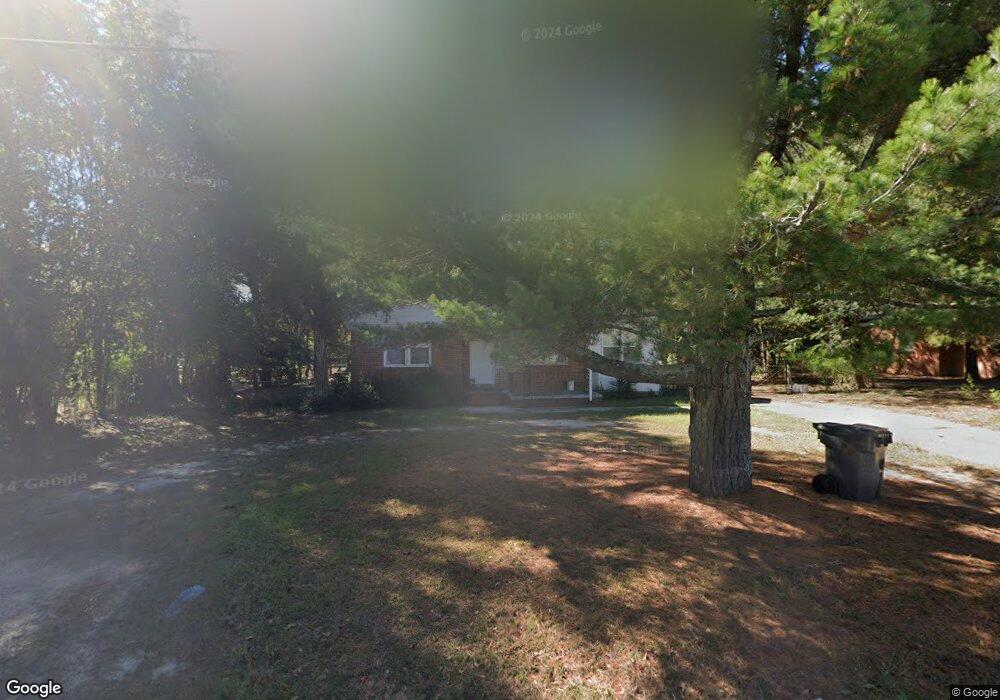
2527 Pineview Dr Augusta, GA 30906
Richmond Hill NeighborhoodEstimated Value: $86,000 - $129,000
2
Beds
1
Bath
1,111
Sq Ft
$94/Sq Ft
Est. Value
About This Home
This home is located at 2527 Pineview Dr, Augusta, GA 30906 and is currently estimated at $104,055, approximately $93 per square foot. 2527 Pineview Dr is a home located in Richmond County with nearby schools including Glenn Hills Middle School, Johnson Magnet, and Glenn Hills High School.
Ownership History
Date
Name
Owned For
Owner Type
Purchase Details
Closed on
Oct 4, 2018
Sold by
Hcg Investments Llc
Bought by
Lin Dobin
Current Estimated Value
Purchase Details
Closed on
Sep 13, 2016
Sold by
Harold C
Bought by
Hcg Investments Llc
Purchase Details
Closed on
May 25, 1995
Sold by
Housing & Urban Development Secretary Of
Bought by
Galloway Harold C
Purchase Details
Closed on
May 18, 1995
Sold by
Housing & Urban Dev
Bought by
Galloway Harold C
Purchase Details
Closed on
Jan 20, 1995
Sold by
Source One Mortgage Services Corp
Bought by
Housing & Urban Development Secretary Of
Purchase Details
Closed on
Dec 6, 1994
Sold by
Source One Mortgage
Bought by
Housing & Urban Dev
Purchase Details
Closed on
Feb 12, 1988
Sold by
Elmy Marshall O
Bought by
Elmy Mary A
Purchase Details
Closed on
Sep 1, 1987
Sold by
Schofield Gary Lee
Bought by
Elmy Marshall O
Purchase Details
Closed on
Oct 1, 1979
Create a Home Valuation Report for This Property
The Home Valuation Report is an in-depth analysis detailing your home's value as well as a comparison with similar homes in the area
Home Values in the Area
Average Home Value in this Area
Purchase History
| Date | Buyer | Sale Price | Title Company |
|---|---|---|---|
| Lin Dobin | $28,000 | -- | |
| Hcg Investments Llc | -- | -- | |
| Galloway Harold C | -- | -- | |
| Galloway Harold C | $30,300 | -- | |
| Housing & Urban Development Secretary Of | -- | -- | |
| Source One Mortgage Services Corp | -- | -- | |
| Housing & Urban Dev | $50,900 | -- | |
| Source One Mortgage | $50,900 | -- | |
| Elmy Mary A | -- | -- | |
| Elmy Marshall O | $45,900 | -- | |
| -- | $34,000 | -- |
Source: Public Records
Tax History
| Year | Tax Paid | Tax Assessment Tax Assessment Total Assessment is a certain percentage of the fair market value that is determined by local assessors to be the total taxable value of land and additions on the property. | Land | Improvement |
|---|---|---|---|---|
| 2025 | $1,608 | $42,364 | $3,406 | $38,958 |
| 2024 | $1,608 | $41,368 | $3,406 | $37,962 |
| 2023 | $1,112 | $28,128 | $3,406 | $24,722 |
| 2022 | $1,094 | $24,928 | $3,406 | $21,522 |
| 2021 | $1,095 | $22,750 | $3,398 | $19,352 |
| 2020 | $1,150 | $22,750 | $3,398 | $19,352 |
| 2019 | $1,201 | $22,750 | $3,398 | $19,352 |
| 2018 | $1,138 | $22,750 | $3,398 | $19,352 |
| 2017 | $1,090 | $22,750 | $3,398 | $19,352 |
| 2016 | $1,091 | $22,750 | $3,398 | $19,352 |
| 2015 | $1,245 | $22,750 | $3,398 | $19,352 |
| 2014 | $1,098 | $22,750 | $3,398 | $19,352 |
Source: Public Records
Map
Nearby Homes
- 2544 Sheraton Dr
- 2436 N Carolina Ave
- 2558 Lyman St
- 2704 Deen Ave
- 2567 Lyman St
- 2438 N Carolina Ave
- 3047 Acorn Rd
- 2537 Lyman St
- 2533 Lyman St
- 2513 Weldon Dr
- 2434 Young Dr
- 2444 Ridge Rd
- 2916 Whistler Ln
- 3004 Acorn Rd
- 3010 Acorn Rd
- 3324 Blanchard Rd
- 2550 Wheeless Rd
- 2504 Hastings Dr
- 2423 Eagle Dr
- 2811 Glenn Hills Dr
- 2525 Pineview Dr
- 2533 Pineview Dr
- 2526 Pineview Dr
- 2530 Pineview Dr
- 2521 Pineview Dr
- 2535 Pineview Dr
- 2534 Pineview Dr
- 2522 Pineview Dr
- 2535 1/2 Pineview Dr
- 2537 Pineview Dr
- 2538 Pineview Dr
- 2536 Pineview Dr
- 2540 Pineview Dr
- 2511 Pineview Dr
- 2566 Lumpkin Rd
- 2547 Pineview Dr
- 2401 Antebellum Dr
- 2568 Lumpkin Rd
- 2507 Pineview Dr
- 2548 Pineview Dr
Your Personal Tour Guide
Ask me questions while you tour the home.