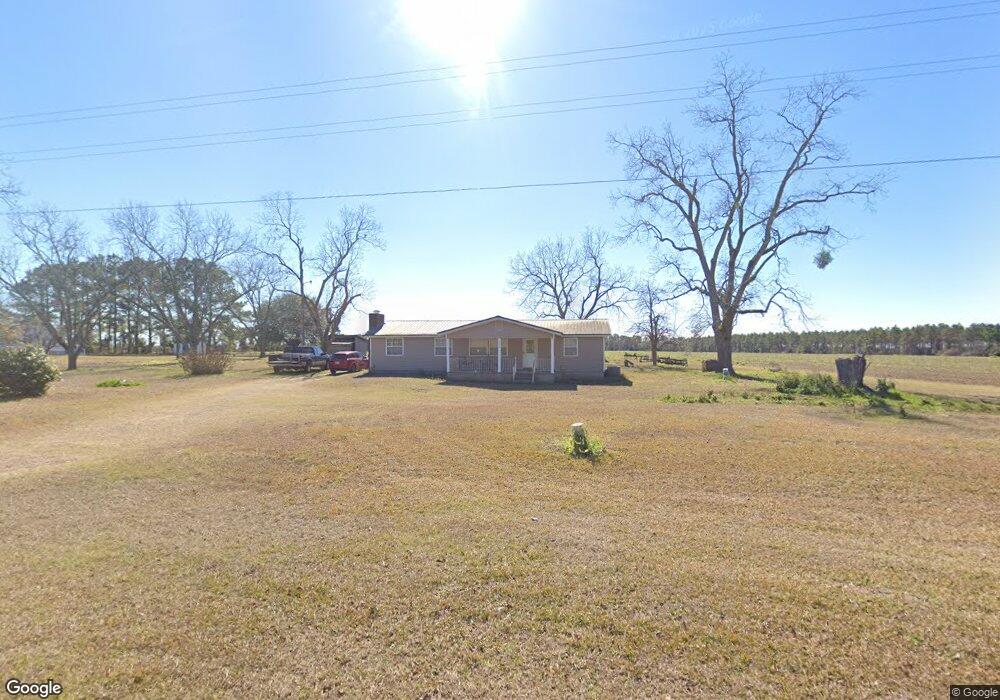
253 Whigham Rd Whigham, GA 39897
Estimated Value: $100,000 - $172,000
3
Beds
2
Baths
1,188
Sq Ft
$118/Sq Ft
Est. Value
About This Home
This home is located at 253 Whigham Rd, Whigham, GA 39897 and is currently estimated at $140,515, approximately $118 per square foot. 253 Whigham Rd is a home located in Grady County.
Ownership History
Date
Name
Owned For
Owner Type
Purchase Details
Closed on
Mar 27, 2018
Sold by
Harrell Rayford
Bought by
Boyd Raenelle H and Harrell Rayford
Current Estimated Value
Purchase Details
Closed on
Mar 5, 2018
Sold by
Harrell Rayford
Bought by
Harrell Rayford and Boyd Raenelle H
Purchase Details
Closed on
Jan 27, 2017
Sold by
Boyd Jeffrey D
Bought by
Harrell Rayford
Purchase Details
Closed on
Apr 12, 2011
Sold by
Us National Bank Assoc
Bought by
Boyd Jeffrey D and Boyd Raenelle H
Home Financials for this Owner
Home Financials are based on the most recent Mortgage that was taken out on this home.
Original Mortgage
$37,116
Interest Rate
4.74%
Mortgage Type
Future Advance Clause Open End Mortgage
Purchase Details
Closed on
Aug 26, 2010
Sold by
Harrell John Rayford
Bought by
U S Bank National
Purchase Details
Closed on
Jul 6, 2010
Sold by
Harrell John Rayford
Bought by
Us Bank National Association
Purchase Details
Closed on
May 15, 2000
Sold by
Harrison Turner M
Bought by
Harrell John Rayford
Purchase Details
Closed on
May 1, 1996
Sold by
Harrison Turner E
Bought by
Harrison Turner M
Create a Home Valuation Report for This Property
The Home Valuation Report is an in-depth analysis detailing your home's value as well as a comparison with similar homes in the area
Home Values in the Area
Average Home Value in this Area
Purchase History
| Date | Buyer | Sale Price | Title Company |
|---|---|---|---|
| Boyd Raenelle H | -- | -- | |
| Harrell Rayford | -- | -- | |
| Harrell Rayford | -- | -- | |
| Boyd Jeffrey D | $40,000 | -- | |
| U S Bank National | -- | -- | |
| Us Bank National Association | $52,275 | -- | |
| Harrell John Rayford | $25,000 | -- | |
| Harrison Turner M | -- | -- |
Source: Public Records
Mortgage History
| Date | Status | Borrower | Loan Amount |
|---|---|---|---|
| Previous Owner | Boyd Jeffrey D | $37,116 |
Source: Public Records
Tax History Compared to Growth
Tax History
| Year | Tax Paid | Tax Assessment Tax Assessment Total Assessment is a certain percentage of the fair market value that is determined by local assessors to be the total taxable value of land and additions on the property. | Land | Improvement |
|---|---|---|---|---|
| 2024 | $1,368 | $44,480 | $3,111 | $41,369 |
| 2023 | $575 | $18,670 | $2,016 | $16,654 |
| 2022 | $575 | $18,670 | $2,016 | $16,654 |
| 2021 | $577 | $18,670 | $2,016 | $16,654 |
| 2020 | $579 | $18,670 | $2,016 | $16,654 |
| 2019 | $579 | $18,670 | $2,016 | $16,654 |
| 2018 | $543 | $18,670 | $2,016 | $16,654 |
| 2017 | $517 | $18,670 | $2,016 | $16,654 |
| 2016 | $449 | $16,126 | $2,016 | $14,110 |
| 2015 | $444 | $16,126 | $2,016 | $14,110 |
| 2014 | $444 | $16,126 | $2,016 | $14,110 |
| 2013 | -- | $16,108 | $3,600 | $12,508 |
Source: Public Records
Map
Nearby Homes
- 233 Whigham Rd
- 262 Whigham Rd
- 241 Whigham Rd
- 310 Whigham Rd
- 584 Att Whigham Rd
- 343 Whigham Rd
- 352 Whigham Rd
- 146 Terrell Ln
- 387 Whigham Rd
- 3543 Ga Highway 112 N
- 3543 Ga Highway 112 N
- 3543 Georgia 112
- 0 Whigham Rd
- 251 Ready Ln
- 526 Ready Ln
- 3349 Ga Highway 112 N
- 818 Womble Rd
- 3616 Ga Highway 112 N
- 837 Womble Rd