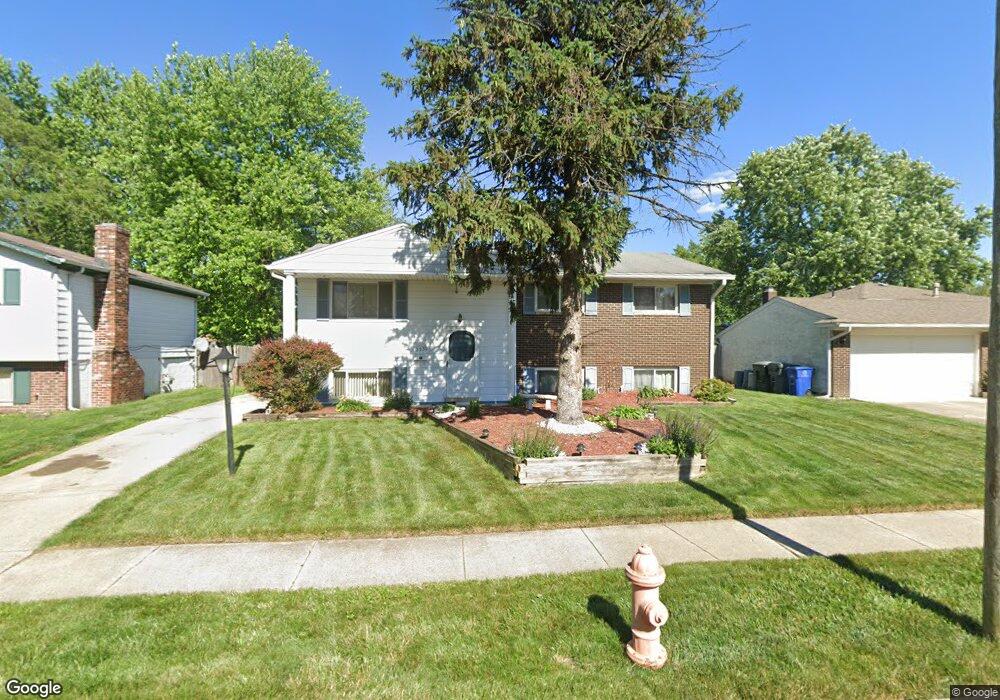
2530 Denmark Rd Columbus, OH 43232
Walnut Heights NeighborhoodEstimated Value: $190,652 - $227,000
5
Beds
2
Baths
984
Sq Ft
$213/Sq Ft
Est. Value
About This Home
This home is located at 2530 Denmark Rd, Columbus, OH 43232 and is currently estimated at $209,663, approximately $213 per square foot. 2530 Denmark Rd is a home located in Franklin County with nearby schools including Liberty Elementary School, Yorktown Middle School, and Independence High School.
Ownership History
Date
Name
Owned For
Owner Type
Purchase Details
Closed on
Nov 26, 2002
Sold by
Pratt Mark S
Bought by
Bosley Tony C and Bosley Candace Y
Current Estimated Value
Purchase Details
Closed on
Jul 13, 2001
Sold by
Kreager Gary Allan and Leader Mtg Company
Bought by
Pratt Mark S and Rpa Development Corp
Purchase Details
Closed on
Aug 1, 1995
Sold by
Kreager Ray R
Bought by
Kreager Gary Allan and Kreager Sharon Louise
Home Financials for this Owner
Home Financials are based on the most recent Mortgage that was taken out on this home.
Original Mortgage
$49,028
Interest Rate
7.59%
Mortgage Type
FHA
Purchase Details
Closed on
Feb 14, 1989
Purchase Details
Closed on
Sep 14, 1988
Create a Home Valuation Report for This Property
The Home Valuation Report is an in-depth analysis detailing your home's value as well as a comparison with similar homes in the area
Home Values in the Area
Average Home Value in this Area
Purchase History
| Date | Buyer | Sale Price | Title Company |
|---|---|---|---|
| Bosley Tony C | $89,900 | -- | |
| Pratt Mark S | $66,700 | -- | |
| Kreager Gary Allan | $48,000 | -- | |
| -- | -- | -- | |
| -- | -- | -- |
Source: Public Records
Mortgage History
| Date | Status | Borrower | Loan Amount |
|---|---|---|---|
| Previous Owner | Kreager Gary Allan | $49,028 |
Source: Public Records
Tax History
| Year | Tax Paid | Tax Assessment Tax Assessment Total Assessment is a certain percentage of the fair market value that is determined by local assessors to be the total taxable value of land and additions on the property. | Land | Improvement |
|---|---|---|---|---|
| 2025 | $3,148 | $70,150 | $17,820 | $52,330 |
| 2024 | $3,148 | $70,150 | $17,820 | $52,330 |
| 2023 | $3,108 | $70,140 | $17,815 | $52,325 |
| 2022 | $1,881 | $36,260 | $6,300 | $29,960 |
| 2021 | $1,884 | $36,260 | $6,300 | $29,960 |
| 2020 | $1,886 | $36,260 | $6,300 | $29,960 |
| 2019 | $1,839 | $30,310 | $5,250 | $25,060 |
| 2018 | $1,721 | $30,310 | $5,250 | $25,060 |
| 2017 | $1,803 | $30,310 | $5,250 | $25,060 |
| 2016 | $1,769 | $26,710 | $4,340 | $22,370 |
| 2015 | $1,606 | $26,710 | $4,340 | $22,370 |
| 2014 | $1,610 | $26,710 | $4,340 | $22,370 |
| 2013 | $882 | $29,680 | $4,830 | $24,850 |
Source: Public Records
Map
Nearby Homes
- 2608 Hubbell Rd
- 2651 Brownfield Rd
- 5114 Carbondale Dr
- 5123 Jameson Dr
- 5144 Botsford Dr
- 2706 Moundcrest St
- 5278 Glenbriar Ct
- 5137 Holbrook Dr
- 2700 Raphael Dr
- 2730 Raphael Dr
- 2615 Carbondale Place
- 2736 Barrows Rd
- 2744 Barrows Rd
- 5326 Adderley Ave
- 2900 Gentry Ln
- 5414 Paladim Rd
- 0 Noe Bixby Rd
- 5290 Quincy Dr
- 5373 Spire Ln
- 2336 Noe Bixby Rd
- 2538 Denmark Rd
- 2522 Denmark Rd
- 2521 Brownfield Rd
- 2544 Denmark Rd
- 2525 Brownfield Rd
- 2516 Denmark Rd
- 2525 Denmark Rd
- 5252 Jameson Dr
- 2552 Denmark Rd
- 5261 Hacket Dr
- 5268 Hackett Drivep
- 2518 Brownfield Rd
- 5268 Hacket Dr
- 2535 Brownfield Rd
- 2560 Denmark Rd
- 5251 Jameson Dr
- 2549 Brownfield Rd
- 5262 Hacket Dr
- 5236 Jameson Dr
- 5253 Hacket Dr
Your Personal Tour Guide
Ask me questions while you tour the home.