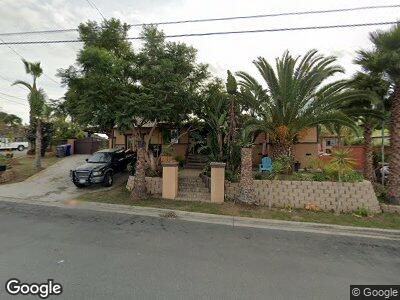
2539 Pahvant St Oceanside, CA 92054
Loma Alta NeighborhoodEstimated Value: $955,000 - $1,103,325
5
Beds
3
Baths
2,104
Sq Ft
$491/Sq Ft
Est. Value
About This Home
This home is located at 2539 Pahvant St, Oceanside, CA 92054 and is currently estimated at $1,032,331, approximately $490 per square foot. 2539 Pahvant St is a home located in San Diego County with nearby schools including Mission Elementary School, Oceanside High School, and Oceanside Adventist Elementary School.
Ownership History
Date
Name
Owned For
Owner Type
Purchase Details
Closed on
Mar 5, 2007
Sold by
Hodges Bernadette
Bought by
Garcia Rudy and Garcia Lisa
Current Estimated Value
Home Financials for this Owner
Home Financials are based on the most recent Mortgage that was taken out on this home.
Original Mortgage
$360,000
Interest Rate
6.37%
Mortgage Type
Purchase Money Mortgage
Purchase Details
Closed on
Jan 26, 2004
Sold by
Marquardt Vivian and Marquardt Eugene
Bought by
Marquardt Eugene
Create a Home Valuation Report for This Property
The Home Valuation Report is an in-depth analysis detailing your home's value as well as a comparison with similar homes in the area
Home Values in the Area
Average Home Value in this Area
Purchase History
| Date | Buyer | Sale Price | Title Company |
|---|---|---|---|
| Garcia Rudy | $450,000 | United Title Company |
Source: Public Records
Mortgage History
| Date | Status | Borrower | Loan Amount |
|---|---|---|---|
| Open | Garcia Rudy | $67,500 | |
| Previous Owner | Garcia Rudy | $360,000 |
Source: Public Records
Tax History Compared to Growth
Tax History
| Year | Tax Paid | Tax Assessment Tax Assessment Total Assessment is a certain percentage of the fair market value that is determined by local assessors to be the total taxable value of land and additions on the property. | Land | Improvement |
|---|---|---|---|---|
| 2024 | $6,452 | $579,466 | $386,311 | $193,155 |
| 2023 | $6,252 | $568,105 | $378,737 | $189,368 |
| 2022 | $6,156 | $556,966 | $371,311 | $185,655 |
| 2021 | $6,179 | $546,046 | $364,031 | $182,015 |
| 2020 | $5,987 | $540,448 | $360,299 | $180,149 |
| 2019 | $5,812 | $529,852 | $353,235 | $176,617 |
| 2018 | $5,548 | $500,000 | $257,000 | $243,000 |
| 2017 | $70 | $470,000 | $242,000 | $228,000 |
| 2016 | $4,938 | $445,000 | $230,000 | $215,000 |
| 2015 | $4,759 | $435,000 | $225,000 | $210,000 |
| 2014 | $4,134 | $385,000 | $200,000 | $185,000 |
Source: Public Records
Map
Nearby Homes
- 2250 Crestline Dr
- 216 Pajama Dr
- 2811 Turnbull St
- 2722 Penkea Dr
- 2845 Cottingham St
- 316 Crouch St
- 2821 Macdonald St
- 0 Saratoga St
- 552 Canyon Dr Unit 15
- 537 Hoover St
- 0 Poplar Rd
- 000 Poplar Rd
- 223 Cottingham Ct
- 306 Fowles St
- 585 Lands End Way Unit 234
- 575 Lands End Way Unit 223
- 201 Foussat Rd
- 555 Lands End Way Unit 213
- 320 Isthmus Way Unit 31
- 332 Cadillac Cir