Estimated Value: $519,000 - $638,000
3
Beds
1
Bath
1,432
Sq Ft
$395/Sq Ft
Est. Value
About This Home
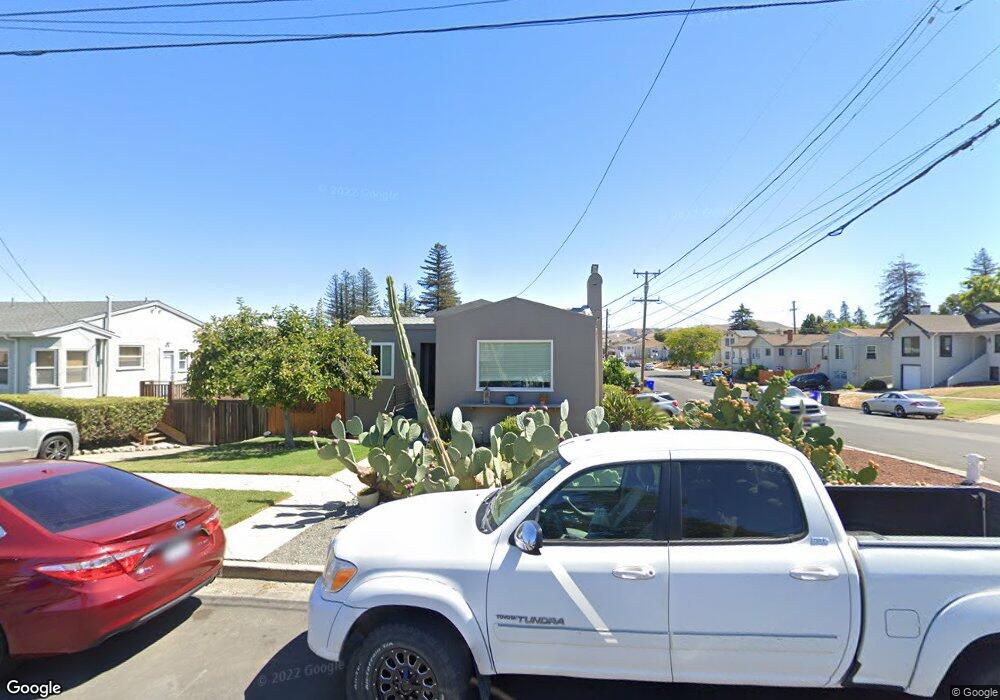
This home is located at 255 Sharon Ave, Rodeo, CA 94572 and is currently estimated at $565,425, approximately $394 per square foot. 255 Sharon Ave is a home located in Contra Costa County with nearby schools including Rodeo Hills Elementary School, Carquinez Middle School, and John Swett High School.
Ownership History
Date
Name
Owned For
Owner Type
Purchase Details
Closed on
Sep 28, 2015
Sold by
Brindle Rogert L and Brindle Margaret A
Bought by
Williams Jason and Mariduena Leanna
Current Estimated Value
Home Financials for this Owner
Home Financials are based on the most recent Mortgage that was taken out on this home.
Original Mortgage
$270,650
Outstanding Balance
$210,445
Interest Rate
3.86%
Mortgage Type
FHA
Estimated Equity
$354,980
Purchase Details
Closed on
Apr 29, 2014
Sold by
Vasconcellos John B
Bought by
Vasconcellos John B
Purchase Details
Closed on
Dec 19, 2006
Sold by
Brindle Roger L and Brindle Margaret A
Bought by
Brindle Roger L and Brindle Margaret A
Purchase Details
Closed on
Jan 15, 2004
Sold by
Vasconcellos John B and Vasconcellos James R
Bought by
Brindle Roger and Brindle Margaret
Home Financials for this Owner
Home Financials are based on the most recent Mortgage that was taken out on this home.
Original Mortgage
$125,000
Interest Rate
5.86%
Mortgage Type
Purchase Money Mortgage
Create a Home Valuation Report for This Property
The Home Valuation Report is an in-depth analysis detailing your home's value as well as a comparison with similar homes in the area
Home Values in the Area
Average Home Value in this Area
Purchase History
| Date | Buyer | Sale Price | Title Company |
|---|---|---|---|
| Williams Jason | $280,000 | Old Republic Title Company | |
| Vasconcellos John B | -- | None Available | |
| Brindle Roger L | -- | None Available | |
| Brindle Roger | $42,000 | Alliance Title Company |
Source: Public Records
Mortgage History
| Date | Status | Borrower | Loan Amount |
|---|---|---|---|
| Open | Williams Jason | $270,650 | |
| Previous Owner | Brindle Roger | $125,000 |
Source: Public Records
Tax History
| Year | Tax Paid | Tax Assessment Tax Assessment Total Assessment is a certain percentage of the fair market value that is determined by local assessors to be the total taxable value of land and additions on the property. | Land | Improvement |
|---|---|---|---|---|
| 2025 | $5,501 | $331,456 | $201,242 | $130,214 |
| 2024 | $5,344 | $324,958 | $197,297 | $127,661 |
| 2023 | $5,277 | $318,587 | $193,429 | $125,158 |
| 2022 | $5,141 | $312,341 | $189,637 | $122,704 |
| 2021 | $5,048 | $306,218 | $185,919 | $120,299 |
| 2019 | $4,924 | $297,137 | $180,405 | $116,732 |
| 2018 | $4,797 | $291,312 | $176,868 | $114,444 |
| 2017 | $4,710 | $285,600 | $173,400 | $112,200 |
| 2016 | $4,331 | $280,000 | $170,000 | $110,000 |
| 2015 | $4,178 | $258,348 | $133,438 | $124,910 |
| 2014 | $4,178 | $176,342 | $91,621 | $84,721 |
Source: Public Records
Map
Nearby Homes
- 215 4th St
- 229 Lake Ave
- 1012 Rock Harbor Point
- 343 Rodeo Ave
- 220 Vaqueros Ave
- 106 White Cap Cove
- 1027 3rd St
- 601 Napa Ave
- 1334 7th St
- 836 Hawthorne Dr
- 909 Seascape Cir
- 834 Coral Ridge Cir
- 943 Coral Ridge Cir
- 801 Dover
- 2036 Serra Ln
- 797 Coral Ridge Cir
- 704 Windsor Unit 704
- 120 Bonita Ct
- 405 Weymouth
- 2054 Clark St
Your Personal Tour Guide
Ask me questions while you tour the home.