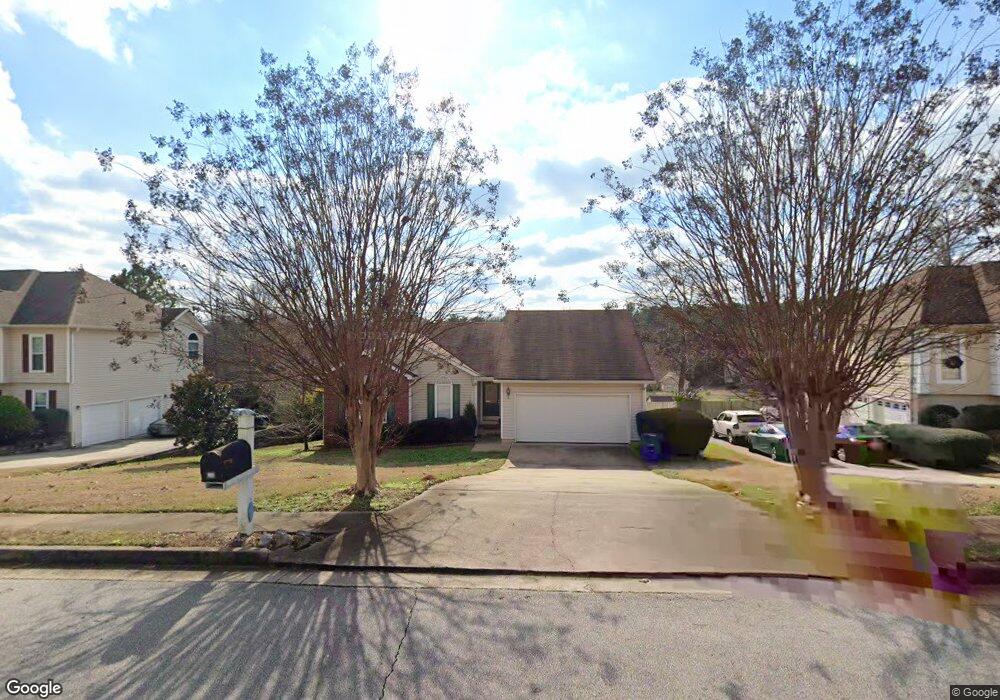
256 Due West Dr Unit 3 Stockbridge, GA 30281
Estimated Value: $245,954 - $295,000
3
Beds
2
Baths
1,575
Sq Ft
$168/Sq Ft
Est. Value
About This Home
This home is located at 256 Due West Dr Unit 3, Stockbridge, GA 30281 and is currently estimated at $264,239, approximately $167 per square foot. 256 Due West Dr Unit 3 is a home located in Henry County with nearby schools including Red Oak Elementary School, Dutchtown Middle School, and Dutchtown High School.
Ownership History
Date
Name
Owned For
Owner Type
Purchase Details
Closed on
Nov 3, 2017
Sold by
Thompson
Bought by
Mccullough Christy G
Current Estimated Value
Home Financials for this Owner
Home Financials are based on the most recent Mortgage that was taken out on this home.
Original Mortgage
$113,898
Outstanding Balance
$96,578
Interest Rate
4.4%
Mortgage Type
FHA
Estimated Equity
$167,661
Purchase Details
Closed on
Nov 29, 2016
Sold by
Scott W
Bought by
Thompson Josh and 256 Due West Drive Trust 256 Due West Dr
Home Financials for this Owner
Home Financials are based on the most recent Mortgage that was taken out on this home.
Original Mortgage
$17,138
Interest Rate
3.54%
Mortgage Type
New Conventional
Purchase Details
Closed on
Aug 24, 1994
Sold by
Knight Devel
Bought by
Dudley Scott W
Home Financials for this Owner
Home Financials are based on the most recent Mortgage that was taken out on this home.
Original Mortgage
$97,393
Interest Rate
8.56%
Mortgage Type
FHA
Create a Home Valuation Report for This Property
The Home Valuation Report is an in-depth analysis detailing your home's value as well as a comparison with similar homes in the area
Home Values in the Area
Average Home Value in this Area
Purchase History
| Date | Buyer | Sale Price | Title Company |
|---|---|---|---|
| Mccullough Christy G | $116,000 | -- | |
| Thompson Josh | $85,205 | -- | |
| Dudley Scott W | $97,100 | -- |
Source: Public Records
Mortgage History
| Date | Status | Borrower | Loan Amount |
|---|---|---|---|
| Open | Mccullough Christy G | $113,898 | |
| Previous Owner | Thompson Josh | $17,138 | |
| Previous Owner | Dudley Scott W | $97,393 |
Source: Public Records
Tax History Compared to Growth
Tax History
| Year | Tax Paid | Tax Assessment Tax Assessment Total Assessment is a certain percentage of the fair market value that is determined by local assessors to be the total taxable value of land and additions on the property. | Land | Improvement |
|---|---|---|---|---|
| 2025 | $3,433 | $107,120 | $14,000 | $93,120 |
| 2024 | $3,433 | $97,720 | $14,000 | $83,720 |
| 2023 | $3,045 | $105,400 | $10,000 | $95,400 |
| 2022 | $2,501 | $83,960 | $10,000 | $73,960 |
| 2021 | $2,015 | $63,400 | $8,000 | $55,400 |
| 2020 | $1,890 | $58,120 | $8,000 | $50,120 |
| 2019 | $1,793 | $54,000 | $8,000 | $46,000 |
| 2018 | $1,854 | $46,400 | $7,656 | $38,744 |
| 2016 | $1,691 | $42,160 | $8,000 | $34,160 |
| 2015 | $1,488 | $35,760 | $7,200 | $28,560 |
| 2014 | $1,398 | $33,080 | $4,800 | $28,280 |
Source: Public Records
Map
Nearby Homes
- 404 Northwind Place
- 263 Northwind Dr
- 512 Chaucer Way Unit 1
- 486 Village Cir
- 213 Sunderland Way Unit 1
- 200 Glynn Addy Dr Unit 5
- 328 Spring Creek Dr
- 235 Alexis Ave
- 1341 Kent Manor Unit 3
- 184 Eagle Way
- 568 Ransom Way
- 236 Northbridge Dr
- 213 Baron Ct
- 318 Eagle Ct
- 145 Glynn Addy Dr Unit 5
- 600 Dairy Dr
- 843 Tramore Dr
- 705 Brentwood Pkwy
- 1653 Jersey Dr
- 1545 Brangus Dr
- 256 Due Dr W
- 252 Due Dr W
- 260 Due West Dr
- 252 Due West Dr Unit 3
- 260 Due Dr W
- 264 Due West Dr Unit 3
- 248 Due West Dr
- 275 Northwind Dr
- 264 Due Dr W
- 279 Northwind Dr
- 271 Northwind Dr Unit 2
- 255 Due West Dr Unit 3
- 263 Due West Dr Unit 3
- 242 Due Dr W
- 268 Due Dr W
- 268 Due West Dr Unit 3
- 242 Due West Dr Unit 3
- 251 Due West Dr Unit 3
- 267 Due Dr W
- 267 Northwind Dr