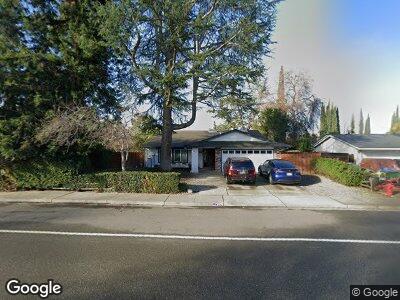
256 Hagemann Dr Livermore, CA 94551
Summerset NeighborhoodEstimated Value: $1,208,000 - $1,353,000
4
Beds
2
Baths
1,561
Sq Ft
$812/Sq Ft
Est. Value
About This Home
This home is located at 256 Hagemann Dr, Livermore, CA 94551 and is currently estimated at $1,266,982, approximately $811 per square foot. 256 Hagemann Dr is a home located in Alameda County with nearby schools including Rancho Las Positas Elementary School, Junction Avenue K-8 School, and Granada High School.
Ownership History
Date
Name
Owned For
Owner Type
Purchase Details
Closed on
Feb 10, 2016
Sold by
Rajputra Gurudev S
Bought by
Rajputra Gurudev S and Bahadur Divya
Current Estimated Value
Home Financials for this Owner
Home Financials are based on the most recent Mortgage that was taken out on this home.
Original Mortgage
$552,000
Interest Rate
3.87%
Mortgage Type
Adjustable Rate Mortgage/ARM
Purchase Details
Closed on
Sep 23, 2014
Sold by
Scrinber Doreen Price and Scribner Family Trust
Bought by
Rajputra Gurudev S
Home Financials for this Owner
Home Financials are based on the most recent Mortgage that was taken out on this home.
Original Mortgage
$557,938
Interest Rate
4.09%
Mortgage Type
New Conventional
Purchase Details
Closed on
Oct 24, 1994
Sold by
Scribner Kenneth Jerome and Scribner Doreen Price
Bought by
Scribner Kenneth Jerome and Scribner Doreen Price
Create a Home Valuation Report for This Property
The Home Valuation Report is an in-depth analysis detailing your home's value as well as a comparison with similar homes in the area
Home Values in the Area
Average Home Value in this Area
Purchase History
| Date | Buyer | Sale Price | Title Company |
|---|---|---|---|
| Rajputra Gurudev S | -- | First American Title Company | |
| Rajputra Gurudev S | $620,000 | Chicago Title Company | |
| Scribner Kenneth Jerome | -- | -- |
Source: Public Records
Mortgage History
| Date | Status | Borrower | Loan Amount |
|---|---|---|---|
| Open | Rajputra Gurudev S | $495,000 | |
| Closed | Rajputra Gurudev Singh | $80,000 | |
| Closed | Rajputra Gurudev S | $548,000 | |
| Closed | Rajputra Gurudev S | $552,000 | |
| Closed | Rajputra Gurudev S | $559,350 | |
| Closed | Rajputra Gurudev S | $557,938 |
Source: Public Records
Tax History Compared to Growth
Tax History
| Year | Tax Paid | Tax Assessment Tax Assessment Total Assessment is a certain percentage of the fair market value that is determined by local assessors to be the total taxable value of land and additions on the property. | Land | Improvement |
|---|---|---|---|---|
| 2024 | $9,438 | $730,514 | $219,154 | $511,360 |
| 2023 | $9,301 | $716,192 | $214,857 | $501,335 |
| 2022 | $9,171 | $702,150 | $210,645 | $491,505 |
| 2021 | $8,987 | $688,385 | $206,515 | $481,870 |
| 2020 | $8,729 | $681,330 | $204,399 | $476,931 |
| 2019 | $8,769 | $667,974 | $200,392 | $467,582 |
| 2018 | $8,586 | $654,880 | $196,464 | $458,416 |
| 2017 | $8,370 | $642,040 | $192,612 | $449,428 |
| 2016 | $8,067 | $629,454 | $188,836 | $440,618 |
| 2015 | $7,568 | $620,000 | $186,000 | $434,000 |
| 2014 | $1,764 | $99,409 | $20,879 | $78,530 |
Source: Public Records
Map
Nearby Homes
- 562 Swallow Dr
- 107 Limestone Common
- 166 Anna Maria St
- 651 Hemlock Ct
- 482 Firenza Ct
- 269 Anna Maria St
- 566 Cedar Dr
- 189 Nadine St
- 693 Mayten Dr
- 243 Northwood Commons
- 125 Northwood Commons
- 477 Brighton Way
- 322 Nadine St
- 709 Oriole Ave
- 515 Zircon Way
- 590 Cinnabar Dr
- 558 Cinnabar Dr
- 576 Emerald St
- 606 Salem Ct
- 1059 Lakehurst Rd
- 256 Hagemann Dr
- 232 Hagemann Dr
- 270 Hagemann Dr
- 261 Yosemite Dr
- 229 Yosemite Dr
- 267 Yosemite Dr
- 204 Hagemann Dr
- 284 Hagemann Dr
- 255 Hagemann Dr
- 211 Yosemite Dr
- 279 Hagemann Dr
- 289 Yosemite Dr
- 227 Hagemann Dr
- 296 Hagemann Dr
- 220 Yosemite Dr
- 203 Hagemann Dr
- 349 Hummingbird Ln
- 208 Yosemite Dr
- 254 Yosemite Dr
- 363 Hummingbird Ln