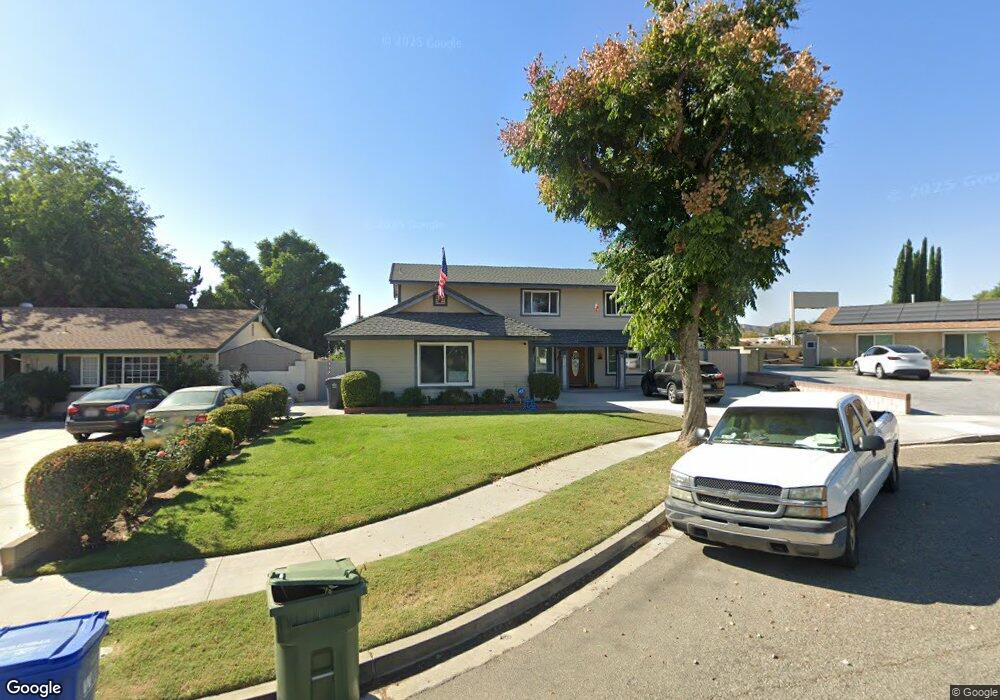
2561 Loretta Cir Simi Valley, CA 93065
Central Simi Valley NeighborhoodEstimated Value: $864,000 - $920,000
4
Beds
3
Baths
2,070
Sq Ft
$431/Sq Ft
Est. Value
About This Home
This home is located at 2561 Loretta Cir, Simi Valley, CA 93065 and is currently estimated at $891,611, approximately $430 per square foot. 2561 Loretta Cir is a home located in Ventura County with nearby schools including Park View Elementary School, Hillside Middle School, and Royal High School.
Ownership History
Date
Name
Owned For
Owner Type
Purchase Details
Closed on
Feb 25, 2002
Sold by
Smith Melvin L and Smith Wona J
Bought by
Schwartz Jon M and Schwartz Sandra
Current Estimated Value
Home Financials for this Owner
Home Financials are based on the most recent Mortgage that was taken out on this home.
Original Mortgage
$282,150
Outstanding Balance
$115,537
Interest Rate
6.78%
Estimated Equity
$776,074
Purchase Details
Closed on
Sep 4, 1997
Sold by
Meeks Donald T and Meeks Thelma M
Bought by
Smith Melvin L and Smith Wona J
Home Financials for this Owner
Home Financials are based on the most recent Mortgage that was taken out on this home.
Original Mortgage
$176,850
Interest Rate
7.44%
Purchase Details
Closed on
Nov 21, 1996
Sold by
Bankers Trust Company Of California Na
Bought by
Meeks Donald T and Meeks Thelma M
Purchase Details
Closed on
Oct 4, 1996
Sold by
Baer William F
Bought by
Bankers Trust Company Of California Na
Create a Home Valuation Report for This Property
The Home Valuation Report is an in-depth analysis detailing your home's value as well as a comparison with similar homes in the area
Home Values in the Area
Average Home Value in this Area
Purchase History
| Date | Buyer | Sale Price | Title Company |
|---|---|---|---|
| Schwartz Jon M | $297,000 | Old Republic Title Company | |
| Smith Melvin L | $196,500 | -- | |
| Meeks Donald T | $156,500 | Chicago Title Co | |
| Bankers Trust Company Of California Na | $183,346 | Fidelity National Title Ins |
Source: Public Records
Mortgage History
| Date | Status | Borrower | Loan Amount |
|---|---|---|---|
| Open | Schwartz Jon M | $282,150 | |
| Previous Owner | Smith Melvin L | $176,850 |
Source: Public Records
Tax History Compared to Growth
Tax History
| Year | Tax Paid | Tax Assessment Tax Assessment Total Assessment is a certain percentage of the fair market value that is determined by local assessors to be the total taxable value of land and additions on the property. | Land | Improvement |
|---|---|---|---|---|
| 2025 | $5,438 | $438,730 | $175,490 | $263,240 |
| 2024 | $5,438 | $430,128 | $172,049 | $258,079 |
| 2023 | $5,112 | $421,695 | $168,676 | $253,019 |
| 2022 | $5,085 | $413,427 | $165,369 | $248,058 |
| 2021 | $5,042 | $405,321 | $162,126 | $243,195 |
| 2020 | $4,934 | $401,166 | $160,464 | $240,702 |
| 2019 | $4,708 | $393,301 | $157,318 | $235,983 |
| 2018 | $4,664 | $385,590 | $154,234 | $231,356 |
| 2017 | $4,557 | $378,030 | $151,210 | $226,820 |
| 2016 | $4,351 | $370,619 | $148,246 | $222,373 |
| 2015 | $4,256 | $365,054 | $146,020 | $219,034 |
| 2014 | $4,192 | $357,905 | $143,160 | $214,745 |
Source: Public Records
Map
Nearby Homes
- 2355 E Alden St
- 2442 N Alden St
- 2719 Licia Place
- 2410 N Justin Ave
- 2718 Licia Place
- 2752 Wanda Ave
- 2357 Lawnview Ct
- 2306 Madrone St
- 2320 Lupin St
- 2650 Belburn Place
- 2266 Lansdale Ct
- 2213 Dogwood St
- 2671 Coral Gum Ln
- 2149 Madrone St
- 2163 N Justin Ave
- 2679 Velma Ct
- 2148 Stoneman St
- 2649 Nicholas St
- 2149 Clover St
- 2239 McDonald St
- 2553 Loretta Cir
- 2574 Marilyn St
- 2577 Loretta Cir
- 2562 Marilyn St
- 2586 Marilyn St
- 2541 Loretta Cir
- 2593 Loretta Cir
- 2540 Marilyn St
- 2560 Loretta Cir
- 2552 Loretta Cir
- 2397 Marilyn St
- 2592 Loretta Cir
- 2537 Loretta Cir
- 2540 Loretta Cir
- 2536 Marilyn St
- 2384 Marilyn St
- 2385 Marilyn St
- 2565 N Phyllis St
- 2536 Loretta Cir
- 2529 Loretta Cir