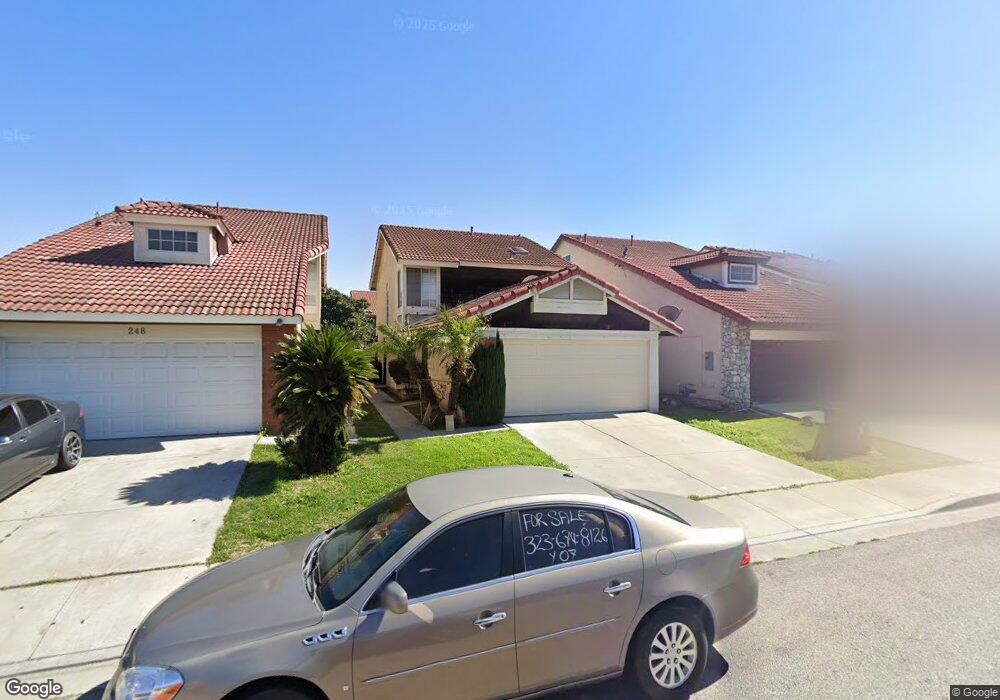
258 S Grape Ave Compton, CA 90220
Estimated Value: $629,825 - $656,000
3
Beds
2
Baths
1,398
Sq Ft
$460/Sq Ft
Est. Value
About This Home
This home is located at 258 S Grape Ave, Compton, CA 90220 and is currently estimated at $642,706, approximately $459 per square foot. 258 S Grape Ave is a home located in Los Angeles County with nearby schools including Longfellow Elementary School, Benjamin O. Davis Middle School, and Compton High School.
Ownership History
Date
Name
Owned For
Owner Type
Purchase Details
Closed on
Jul 19, 2022
Sold by
May Philip
Bought by
Philip & Paula May Family Trust
Current Estimated Value
Purchase Details
Closed on
Feb 4, 2022
Sold by
May Teresa
Bought by
May Thomas
Home Financials for this Owner
Home Financials are based on the most recent Mortgage that was taken out on this home.
Original Mortgage
$200,000
Interest Rate
3.56%
Mortgage Type
New Conventional
Purchase Details
Closed on
Feb 2, 2022
Sold by
May Paula
Bought by
May Philip
Home Financials for this Owner
Home Financials are based on the most recent Mortgage that was taken out on this home.
Original Mortgage
$200,000
Interest Rate
3.56%
Mortgage Type
New Conventional
Purchase Details
Closed on
Nov 10, 2012
Sold by
May William
Bought by
May Thomas and May Philip
Purchase Details
Closed on
May 13, 1998
Sold by
May Thomas
Bought by
May Thomas and Thomas May Revocable Living Trust
Create a Home Valuation Report for This Property
The Home Valuation Report is an in-depth analysis detailing your home's value as well as a comparison with similar homes in the area
Home Values in the Area
Average Home Value in this Area
Purchase History
| Date | Buyer | Sale Price | Title Company |
|---|---|---|---|
| Philip & Paula May Family Trust | -- | None Listed On Document | |
| May Thomas | -- | Orange Coast Title | |
| May Philip | -- | Orange Coast Title | |
| May Kenneth | -- | Orange Coast Title | |
| May Thomas | -- | None Available | |
| May Thomas | -- | -- |
Source: Public Records
Mortgage History
| Date | Status | Borrower | Loan Amount |
|---|---|---|---|
| Previous Owner | May Thomas | $200,000 |
Source: Public Records
Tax History
| Year | Tax Paid | Tax Assessment Tax Assessment Total Assessment is a certain percentage of the fair market value that is determined by local assessors to be the total taxable value of land and additions on the property. | Land | Improvement |
|---|---|---|---|---|
| 2025 | $6,205 | $339,445 | $209,114 | $130,331 |
| 2024 | $6,205 | $332,790 | $205,014 | $127,776 |
| 2023 | $6,120 | $326,266 | $200,995 | $125,271 |
| 2022 | $3,186 | $181,927 | $72,484 | $109,443 |
| 2021 | $3,209 | $178,361 | $71,063 | $107,298 |
| 2019 | $3,114 | $173,072 | $68,956 | $104,116 |
| 2018 | $3,028 | $169,679 | $67,604 | $102,075 |
| 2016 | $2,870 | $163,092 | $64,980 | $98,112 |
| 2015 | $2,744 | $160,643 | $64,004 | $96,639 |
| 2014 | $2,695 | $157,497 | $62,751 | $94,746 |
Source: Public Records
Map
Nearby Homes
- 310 S Paulsen Ave
- 159 S Wilmington Ave Unit F
- 157 S Wilmington Ave Unit I
- 155 S Wilmington Ave Unit C
- 820 W Compton Blvd Unit 17
- 653 W Compton Blvd
- 969 W Dhalia St
- 533 W Almond St
- 623 W Indigo St
- 524 W Laurel St
- 485 W Compton Blvd
- 640 W Palmer St
- 910 W Palmer St
- 531 W Palmer St
- 435 W Almond St
- 940 W Brazil St
- 427 W Laurel St
- 213 N Broadacres Ave
- 436 W Magnolia St
- 426 W Laurel St
- 248 S Grape Ave
- 268 S Grape Ave
- 238 S Grape Ave
- 278 S Grape Ave
- 228 S Grape Ave
- 300 S Grape Ave
- 259 S Paulsen Ave
- 249 S Paulsen Ave
- 269 S Paulsen Ave
- 279 S Paulsen Ave
- 239 S Paulsen Ave
- 308 S Grape Ave
- 218 S Grape Ave
- 301 S Paulsen Ave
- 229 S Paulsen Ave
- 257 S Grape Ave
- 267 S Grape Ave
- 247 S Grape Ave
- 277 S Grape Ave
- 318 S Grape Ave
Your Personal Tour Guide
Ask me questions while you tour the home.