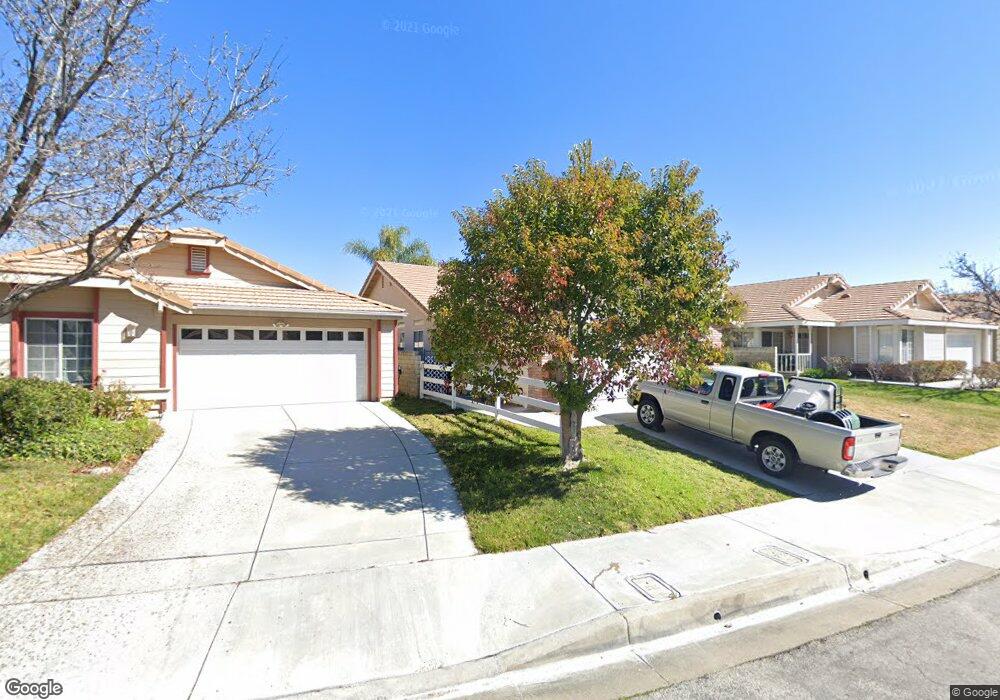
25846 Anderson Ln Stevenson Ranch, CA 91381
Estimated Value: $795,527 - $910,000
4
Beds
2
Baths
1,600
Sq Ft
$545/Sq Ft
Est. Value
About This Home
This home is located at 25846 Anderson Ln, Stevenson Ranch, CA 91381 and is currently estimated at $871,882, approximately $544 per square foot. 25846 Anderson Ln is a home located in Los Angeles County with nearby schools including Pico Canyon Elementary School, Rancho Pico Junior High School, and West Ranch High School.
Ownership History
Date
Name
Owned For
Owner Type
Purchase Details
Closed on
Dec 14, 2020
Sold by
Erwin And Doris J Rubin Family Trust and Family Trust
Bought by
Grant M Rubin Supplemental Needs Trust and Rubin
Current Estimated Value
Purchase Details
Closed on
Feb 21, 2012
Sold by
Rubin Mark W and Rubin Carole L
Bought by
Rubin Carole L and Rubin Mark W
Purchase Details
Closed on
Oct 4, 2000
Sold by
Sico Lou C
Bought by
Rubin Erwin and Rubin Doris J
Purchase Details
Closed on
May 20, 1999
Sold by
Sico Lou C and Mercado Elizabeth
Bought by
Sico Lou C
Purchase Details
Closed on
Jul 13, 1994
Sold by
Dale Poe Development Corp
Bought by
Sico Lou C and Mercado Elizabeth
Home Financials for this Owner
Home Financials are based on the most recent Mortgage that was taken out on this home.
Original Mortgage
$200,350
Interest Rate
5.75%
Create a Home Valuation Report for This Property
The Home Valuation Report is an in-depth analysis detailing your home's value as well as a comparison with similar homes in the area
Home Values in the Area
Average Home Value in this Area
Purchase History
| Date | Buyer | Sale Price | Title Company |
|---|---|---|---|
| Grant M Rubin Supplemental Needs Trust | -- | None Listed On Document | |
| Rubin Carole L | -- | None Available | |
| Rubin Erwin | $263,000 | Commonwealth Title | |
| Sico Lou C | -- | -- | |
| Sico Lou C | $223,000 | Chicago Title Company |
Source: Public Records
Mortgage History
| Date | Status | Borrower | Loan Amount |
|---|---|---|---|
| Previous Owner | Sico Lou C | $200,350 |
Source: Public Records
Tax History Compared to Growth
Tax History
| Year | Tax Paid | Tax Assessment Tax Assessment Total Assessment is a certain percentage of the fair market value that is determined by local assessors to be the total taxable value of land and additions on the property. | Land | Improvement |
|---|---|---|---|---|
| 2025 | $6,428 | $402,521 | $222,248 | $180,273 |
| 2024 | $6,428 | $388,510 | $217,891 | $170,619 |
| 2023 | $6,237 | $380,893 | $213,619 | $167,274 |
| 2022 | $6,120 | $373,426 | $209,431 | $163,995 |
| 2021 | $5,980 | $366,105 | $205,325 | $160,780 |
| 2020 | $5,918 | $362,352 | $203,220 | $159,132 |
| 2019 | $5,776 | $355,248 | $199,236 | $156,012 |
| 2018 | $5,557 | $348,283 | $195,330 | $152,953 |
| 2016 | $5,263 | $334,760 | $187,746 | $147,014 |
| 2015 | $5,153 | $329,732 | $184,926 | $144,806 |
| 2014 | $4,956 | $323,274 | $181,304 | $141,970 |
Source: Public Records
Map
Nearby Homes
- 25730 Wordsworth Ln
- 25804 Webster Place
- 25710 Wagner Way Unit C
- 25710 Wagner Way Unit C
- 25768 Perlman Place Unit A
- 25547 Clemens Ct
- 25514 Baker Place
- 26064 Twain Place
- 25507 Longfellow Place
- 27415 Creekwood Ln
- 27403 Creekwood Ln
- 25463 Hardy Place
- 25455 Hardy Place
- 25843 Browning Place
- 25518 Hemingway Ave Unit A
- 25614 Housman Place
- 25118 Steinbeck Ave Unit A
- 25815 Dickens Ct Unit 8
- 25512 Wilde Ave
- 27457 Lumber Pine Place
- 25850 Anderson Ln
- 25832 Anderson Ln
- 25845 Anderson Ln
- 25849 Anderson Ln
- 25841 Anderson Ln
- 25853 Anderson Ln
- 25857 Anderson Ln
- 25826 Anderson Ln
- 25573 Burns Place
- 25837 Anderson Ln
- 25861 Anderson Ln
- 25865 Anderson Ln
- 25831 Anderson Ln
- 25822 Anderson Ln
- 25823 Anderson Ln
- 25568 Burns Place
- 25728 Wordsworth Ln
- 25846 Webster Place
- 25840 Webster Place