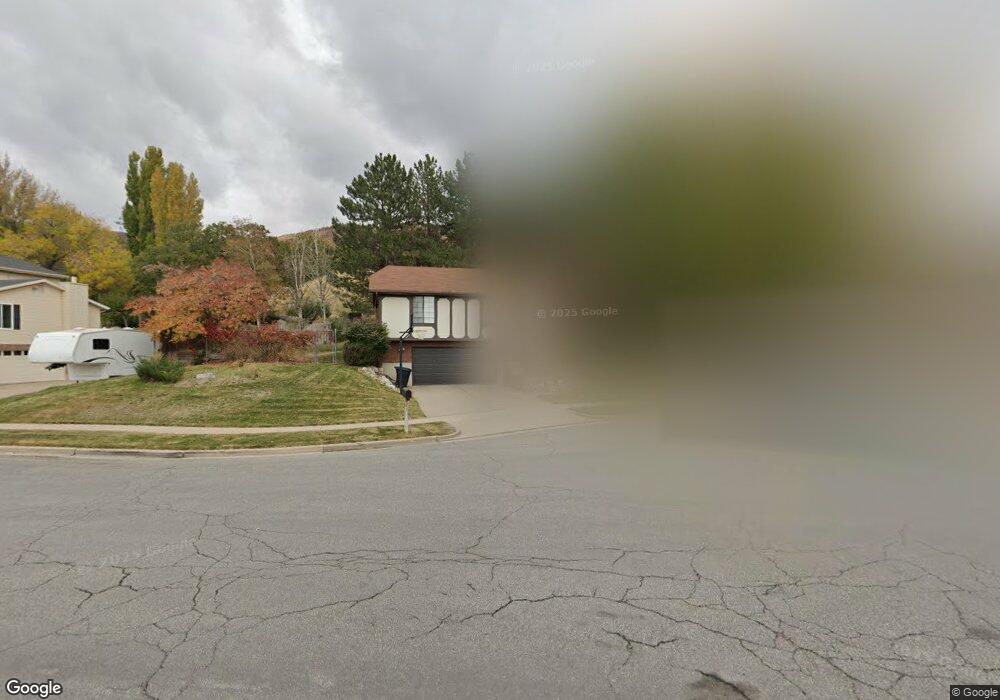
259 S 1375 E Bountiful, UT 84010
Estimated Value: $570,000 - $697,000
4
Beds
3
Baths
2,285
Sq Ft
$270/Sq Ft
Est. Value
About This Home
This home is located at 259 S 1375 E, Bountiful, UT 84010 and is currently estimated at $616,329, approximately $269 per square foot. 259 S 1375 E is a home located in Davis County with nearby schools including Oak Hills School, Millcreek Junior High School, and Bountiful High School.
Ownership History
Date
Name
Owned For
Owner Type
Purchase Details
Closed on
May 21, 2018
Sold by
Peterson Susan Gail and Gail Peterson S
Bought by
Peterson Craig Thomas and Peterson Susan Gail
Current Estimated Value
Home Financials for this Owner
Home Financials are based on the most recent Mortgage that was taken out on this home.
Original Mortgage
$254,375
Outstanding Balance
$222,743
Interest Rate
5.62%
Mortgage Type
FHA
Estimated Equity
$393,586
Purchase Details
Closed on
Feb 14, 2003
Sold by
Hawks James G
Bought by
Peterson S Gail
Home Financials for this Owner
Home Financials are based on the most recent Mortgage that was taken out on this home.
Original Mortgage
$141,000
Interest Rate
5.93%
Purchase Details
Closed on
Feb 12, 1999
Sold by
Mattson Sharon G
Bought by
Hawks James G and Gail Peterson S
Home Financials for this Owner
Home Financials are based on the most recent Mortgage that was taken out on this home.
Original Mortgage
$144,800
Interest Rate
6.77%
Create a Home Valuation Report for This Property
The Home Valuation Report is an in-depth analysis detailing your home's value as well as a comparison with similar homes in the area
Purchase History
| Date | Buyer | Sale Price | Title Company |
|---|---|---|---|
| Peterson Craig Thomas | -- | Inwest Title | |
| Peterson S Gail | -- | Security Title Insurance Age | |
| Hawks James G | -- | Equity Title Agency |
Source: Public Records
Mortgage History
| Date | Status | Borrower | Loan Amount |
|---|---|---|---|
| Open | Peterson Craig Thomas | $254,375 | |
| Closed | Peterson S Gail | $141,000 | |
| Previous Owner | Hawks James G | $144,800 |
Source: Public Records
Tax History
| Year | Tax Paid | Tax Assessment Tax Assessment Total Assessment is a certain percentage of the fair market value that is determined by local assessors to be the total taxable value of land and additions on the property. | Land | Improvement |
|---|---|---|---|---|
| 2025 | $3,174 | $287,100 | $143,147 | $143,953 |
| 2024 | $2,940 | $275,550 | $131,942 | $143,608 |
| 2023 | $2,839 | $483,000 | $239,758 | $243,242 |
| 2022 | $2,943 | $275,000 | $127,742 | $147,258 |
| 2021 | $2,769 | $384,000 | $189,906 | $194,094 |
| 2020 | $2,379 | $328,000 | $164,675 | $163,325 |
| 2019 | $2,292 | $320,000 | $161,107 | $158,893 |
| 2018 | $2,116 | $290,000 | $149,809 | $140,191 |
| 2016 | $1,922 | $138,820 | $73,842 | $64,978 |
| 2015 | $1,856 | $126,225 | $73,842 | $52,383 |
| 2014 | $2,071 | $142,626 | $73,842 | $68,784 |
| 2013 | -- | $107,030 | $59,840 | $47,190 |
Source: Public Records
Map
Nearby Homes
- 331 S 1550 E Unit 3
- 1138 Briggs Dr
- 144 Bountiful Blvd
- 0 Lot Bountiful Blvd
- 111 Eagle Ridge Dr
- 6 N 800 E
- 129 N 800 E
- 1342 E Skyline Dr N Unit 30
- 698 E 200 S
- 908 Northern Hills Dr Unit 3
- 683 E 100 N
- 933 Northern Hills Cir
- 861 E Millbrook Way
- 1596 E Millbrook Way
- 1735 S Temple Ct Unit 203
- 1785 1450 E
- 775 E 1500 S
- 795 Abby Ln Unit 5
- 456 E 500 S
- 520 S Orchard Dr Unit 17
Your Personal Tour Guide
Ask me questions while you tour the home.