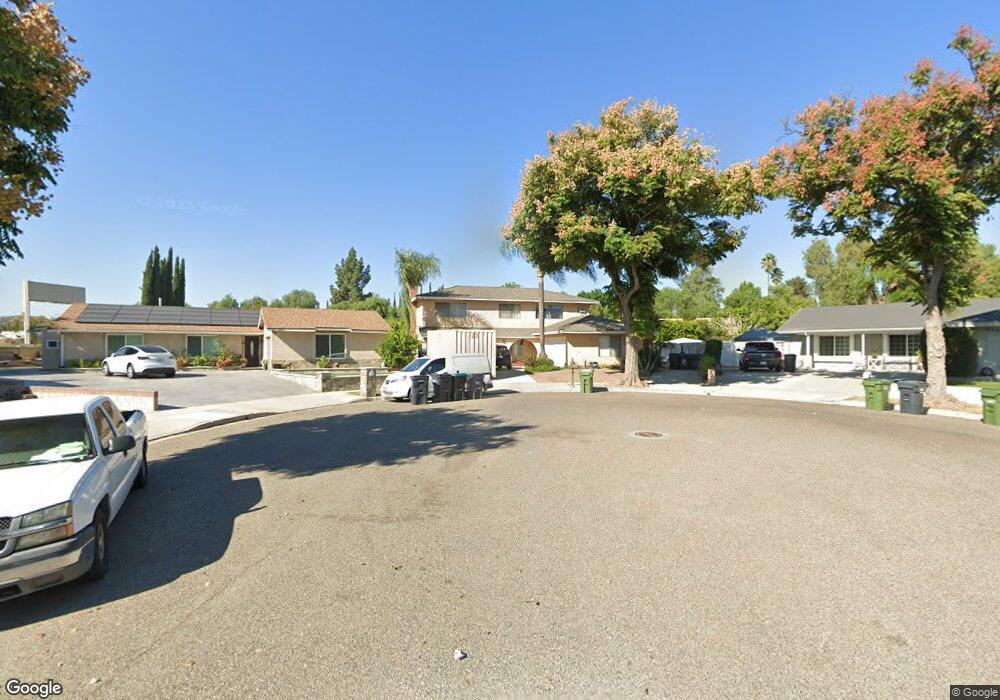
2593 Loretta Cir Simi Valley, CA 93065
Central Simi Valley NeighborhoodEstimated Value: $798,000 - $885,000
4
Beds
3
Baths
2,070
Sq Ft
$410/Sq Ft
Est. Value
About This Home
This home is located at 2593 Loretta Cir, Simi Valley, CA 93065 and is currently estimated at $848,570, approximately $409 per square foot. 2593 Loretta Cir is a home located in Ventura County with nearby schools including Park View Elementary School, Hillside Middle School, and Royal High School.
Ownership History
Date
Name
Owned For
Owner Type
Purchase Details
Closed on
Feb 11, 2021
Sold by
Jackson Lyle L
Bought by
Jackson Lyle L and Lyle L Jackson Family Trust
Current Estimated Value
Purchase Details
Closed on
Feb 7, 2021
Sold by
Fox Lawrence D and Fox Patricia A
Bought by
Jackson Lyle L
Purchase Details
Closed on
Aug 3, 2016
Sold by
Fox Patricia A
Bought by
Fox Lawrence D and Fox Patricia A
Purchase Details
Closed on
Sep 24, 2002
Sold by
Fox Lawrence D and Fox Patricia A
Bought by
Fox Patricia A
Home Financials for this Owner
Home Financials are based on the most recent Mortgage that was taken out on this home.
Original Mortgage
$175,500
Interest Rate
6.16%
Purchase Details
Closed on
May 31, 1995
Sold by
Jackson Reginald Dwayne
Bought by
Jackson Lyle Lisette Bluitt
Purchase Details
Closed on
May 27, 1995
Sold by
Fox Lawrence D
Bought by
Fox Patricia A
Create a Home Valuation Report for This Property
The Home Valuation Report is an in-depth analysis detailing your home's value as well as a comparison with similar homes in the area
Home Values in the Area
Average Home Value in this Area
Purchase History
| Date | Buyer | Sale Price | Title Company |
|---|---|---|---|
| Jackson Lyle L | -- | None Available | |
| Jackson Lyle L | -- | None Available | |
| Fox Lawrence D | -- | None Available | |
| Fox Patricia A | -- | Old Republic Title Company | |
| Fox Lawrence D | -- | Old Republic Title Ins Compa | |
| Jackson Lyle Lisette Bluitt | -- | -- | |
| Fox Patricia A | -- | -- |
Source: Public Records
Mortgage History
| Date | Status | Borrower | Loan Amount |
|---|---|---|---|
| Previous Owner | Fox Lawrence D | $175,500 |
Source: Public Records
Tax History
| Year | Tax Paid | Tax Assessment Tax Assessment Total Assessment is a certain percentage of the fair market value that is determined by local assessors to be the total taxable value of land and additions on the property. | Land | Improvement |
|---|---|---|---|---|
| 2025 | $3,609 | $269,137 | $120,923 | $148,214 |
| 2024 | $3,609 | $263,860 | $118,552 | $145,308 |
| 2023 | $3,390 | $258,687 | $116,228 | $142,459 |
| 2022 | $3,355 | $253,615 | $113,949 | $139,666 |
| 2021 | $3,388 | $248,643 | $111,715 | $136,928 |
| 2020 | $3,306 | $246,095 | $110,570 | $135,525 |
| 2019 | $3,154 | $241,270 | $108,402 | $132,868 |
| 2018 | $3,116 | $236,540 | $106,277 | $130,263 |
| 2017 | $3,038 | $231,903 | $104,194 | $127,709 |
| 2016 | $2,899 | $227,356 | $102,151 | $125,205 |
| 2015 | $2,829 | $223,942 | $100,617 | $123,325 |
| 2014 | $2,778 | $219,557 | $98,647 | $120,910 |
Source: Public Records
Map
Nearby Homes
- 2516 E Phyllis St
- 2718 Licia Place
- 2752 Wanda Ave
- 2183 E Chesterton St
- 2357 Lawnview Ct
- 2385 N Justin Ave
- 2325 Wisteria St
- 2756 N Dalenhurst Place
- 2781 N Woodrow Ave
- 2371 Larch St
- 2671 Coral Gum Ln
- 2235 Clover St
- 2189 Latham St
- 2239 McDonald St
- 2146 N Brower St
- 2832 Thicket Place
- 3067 Harrison Ln
- 3010 Tallahassee Ln
- 3049 Tallahassee Ln
- 2727 Reservoir Dr
- 2577 Loretta Cir
- 2592 Loretta Cir
- 2561 Loretta Cir
- 2560 Loretta Cir
- 2586 Marilyn St
- 2593 N Phyllis St
- 2574 Marilyn St
- 2553 Loretta Cir
- 2552 Loretta Cir
- 2565 N Phyllis St
- 2397 Marilyn St
- 2562 Marilyn St
- 2411 E Phyllis St
- 2541 Loretta Cir
- 2551 N Phyllis St
- 2540 Loretta Cir
- 2385 Marilyn St
- 2540 Marilyn St
- 2543 N Phyllis St
- 2537 Loretta Cir
Your Personal Tour Guide
Ask me questions while you tour the home.