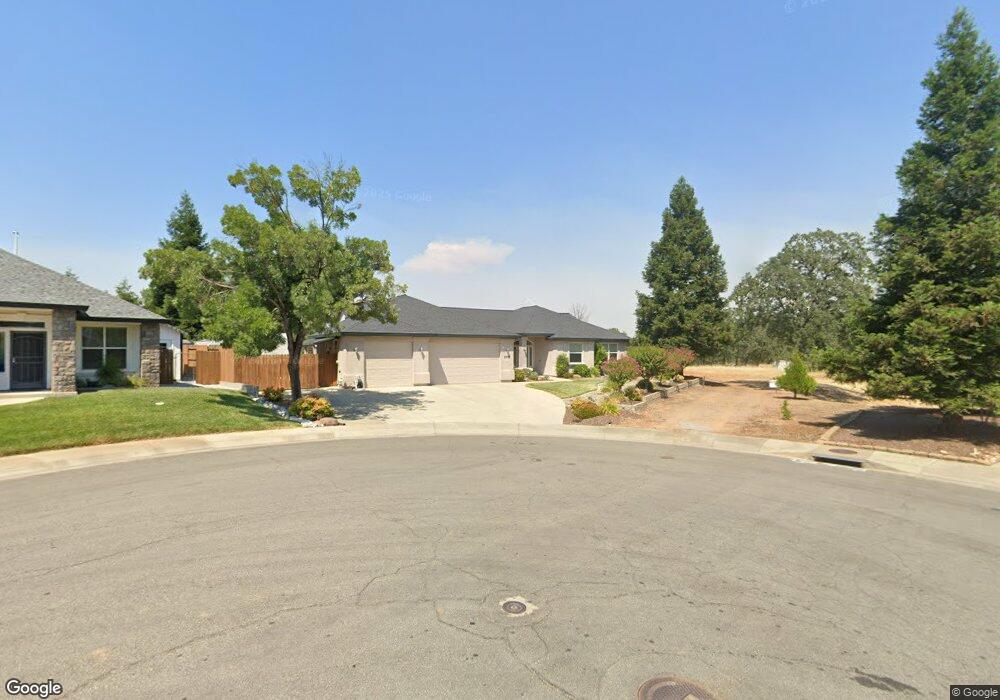
2594 Warm Spring Ln Redding, CA 96003
Simpson University Region NeighborhoodEstimated Value: $498,000 - $583,000
3
Beds
2
Baths
2,046
Sq Ft
$266/Sq Ft
Est. Value
About This Home
This home is located at 2594 Warm Spring Ln, Redding, CA 96003 and is currently estimated at $544,804, approximately $266 per square foot. 2594 Warm Spring Ln is a home located in Shasta County with nearby schools including Columbia Elementary School, Mountain View Middle School, and Foothill High School.
Create a Home Valuation Report for This Property
The Home Valuation Report is an in-depth analysis detailing your home's value as well as a comparison with similar homes in the area
Home Values in the Area
Average Home Value in this Area
Tax History
| Year | Tax Paid | Tax Assessment Tax Assessment Total Assessment is a certain percentage of the fair market value that is determined by local assessors to be the total taxable value of land and additions on the property. | Land | Improvement |
|---|---|---|---|---|
| 2025 | $4,926 | $466,323 | $40,094 | $426,229 |
| 2024 | $4,946 | $457,180 | $39,308 | $417,872 |
| 2023 | $4,946 | $448,217 | $38,538 | $409,679 |
| 2022 | $4,778 | $439,430 | $37,783 | $401,647 |
| 2021 | $4,772 | $430,815 | $37,043 | $393,772 |
| 2020 | $4,712 | $426,399 | $36,664 | $389,735 |
| 2019 | $4,604 | $418,040 | $35,946 | $382,094 |
| 2018 | $4,376 | $376,300 | $58,300 | $318,000 |
| 2017 | $4,260 | $355,000 | $55,000 | $300,000 |
| 2016 | $4,019 | $350,000 | $55,000 | $295,000 |
| 2015 | $4,016 | $350,000 | $55,000 | $295,000 |
| 2014 | $3,468 | $305,000 | $45,000 | $260,000 |
Source: Public Records
Map
Nearby Homes
- 547 Casa Buena St
- 550 Armando Ave
- 2199 Princeton Way
- 2182 Cadjew St
- 2192 Princeton Way
- 2134 Cadjew St
- 006 Old Oregon Trail
- 332 Franciscan Trail
- 965 Willow Brook Ln
- 1090 Gibralter Rd
- 19424 Posey Ln
- 10587 Quail Hollow Dr
- 790 Volcano View Trail
- 19219 Nike Ct
- 667 Reddington Dr
- 1102 Hope Ln
- 531 Fair Hill Dr
- 1110 Grouse Dr
- 19324 Hollow Ln
- 2935 Snow Fire Ct
- 2564 Warm Spring Ln
- 2534 Warm Spring Ln
- 2591 Warm Spring Ln
- 2531 Warm Spring Ln
- 2561 Warm Spring Ln
- 2514 Warm Spring Ln
- 2511 Warm Spring Ln
- 2548 Valencia St
- 2568 Valencia St
- 2528 Valencia St
- 2492 Warm Spring Ln
- 2588 Valencia St
- 2508 Valencia St
- 508 Casa Buena St
- 526 Casa Buena St
- 2462 Warm Spring Ln
- 544 Casa Buena St
- 601 San Gabriel St
- 562 Casa Buena St
- 2432 Warm Spring Ln
Your Personal Tour Guide
Ask me questions while you tour the home.