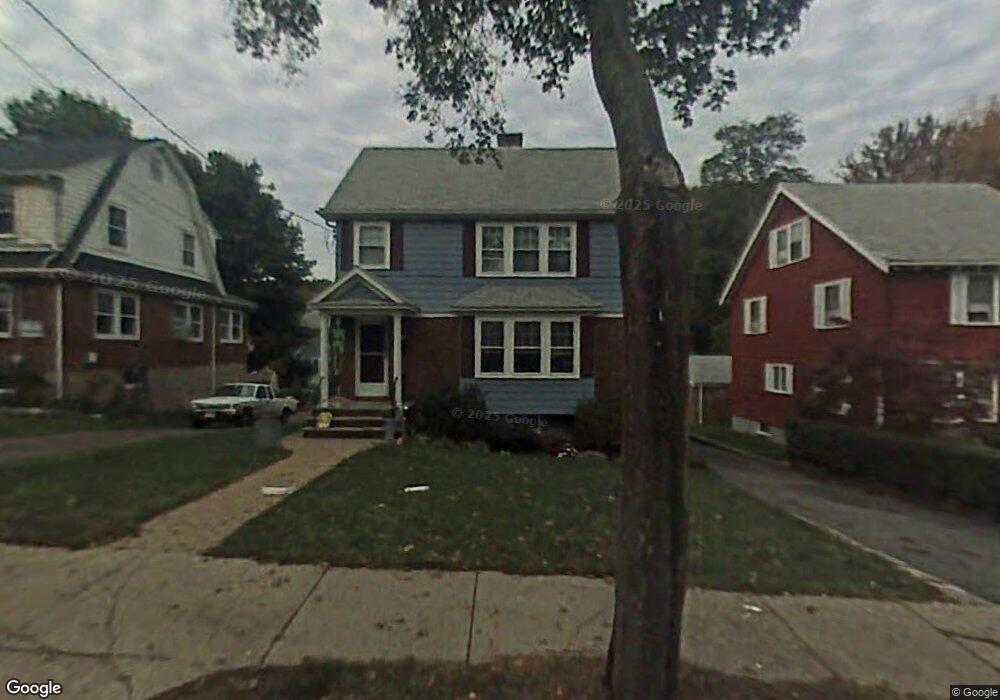
26 Byrd Ave West Newton, MA 02465
West Newton NeighborhoodEstimated Value: $1,109,000 - $1,265,000
3
Beds
2
Baths
1,563
Sq Ft
$743/Sq Ft
Est. Value
About This Home
This home is located at 26 Byrd Ave, West Newton, MA 02465 and is currently estimated at $1,161,229, approximately $742 per square foot. 26 Byrd Ave is a home located in Middlesex County with nearby schools including Franklin Elementary School, C.C. Burr, and F.A. Day Middle School.
Ownership History
Date
Name
Owned For
Owner Type
Purchase Details
Closed on
Aug 2, 2010
Sold by
Roover David and Roover Michelle L
Bought by
Cohen Lisa Jo
Current Estimated Value
Home Financials for this Owner
Home Financials are based on the most recent Mortgage that was taken out on this home.
Original Mortgage
$360,000
Outstanding Balance
$240,866
Interest Rate
4.78%
Mortgage Type
Purchase Money Mortgage
Estimated Equity
$920,363
Purchase Details
Closed on
Jul 16, 1997
Sold by
Evans Robert J and Evans Catherine G
Bought by
Roover David S and Roover Michelle L
Purchase Details
Closed on
Nov 16, 1995
Sold by
Est Decastro Barbara E and Decastro Edson D
Bought by
Evans Robert J and Evans Catherine S
Create a Home Valuation Report for This Property
The Home Valuation Report is an in-depth analysis detailing your home's value as well as a comparison with similar homes in the area
Home Values in the Area
Average Home Value in this Area
Purchase History
| Date | Buyer | Sale Price | Title Company |
|---|---|---|---|
| Cohen Lisa Jo | $610,000 | -- | |
| Roover David S | $319,000 | -- | |
| Evans Robert J | $260,000 | -- |
Source: Public Records
Mortgage History
| Date | Status | Borrower | Loan Amount |
|---|---|---|---|
| Open | Cohen Lisa Jo | $360,000 | |
| Previous Owner | Evans Robert J | $150,000 | |
| Previous Owner | Evans Robert J | $285,000 | |
| Previous Owner | Evans Robert J | $265,000 |
Source: Public Records
Tax History Compared to Growth
Tax History
| Year | Tax Paid | Tax Assessment Tax Assessment Total Assessment is a certain percentage of the fair market value that is determined by local assessors to be the total taxable value of land and additions on the property. | Land | Improvement |
|---|---|---|---|---|
| 2025 | $10,029 | $1,023,400 | $812,800 | $210,600 |
| 2024 | $9,698 | $993,600 | $789,100 | $204,500 |
| 2023 | $9,203 | $904,000 | $591,800 | $312,200 |
| 2022 | $8,805 | $837,000 | $548,000 | $289,000 |
| 2021 | $8,496 | $789,600 | $517,000 | $272,600 |
| 2020 | $8,243 | $789,600 | $517,000 | $272,600 |
| 2019 | $8,011 | $766,600 | $501,900 | $264,700 |
| 2018 | $7,666 | $708,500 | $456,500 | $252,000 |
| 2017 | $7,433 | $668,400 | $430,700 | $237,700 |
| 2016 | $7,109 | $624,700 | $402,500 | $222,200 |
| 2015 | $6,778 | $583,800 | $376,200 | $207,600 |
Source: Public Records
Map
Nearby Homes
- 41 Kilburn Rd
- 53-55 N Gate Park
- 287 Cherry St Unit 2
- 371 Cherry St
- 106 River St Unit 18
- 106 River St Unit 2
- 106 River St Unit 14
- 2 Elm St Unit 6
- 2 Elm St Unit 8
- 429 Cherry St Unit 11
- 66 Webster St
- 44 Westland Ave
- 27 Cross St Unit 27
- 56 Dearborn St
- 79 Chestnut St Unit 2
- 318 Austin St Unit A
- 12 Wiswall St
- 4 Wiswall St
- 12 Inis Cir
- 212 River St Unit 2