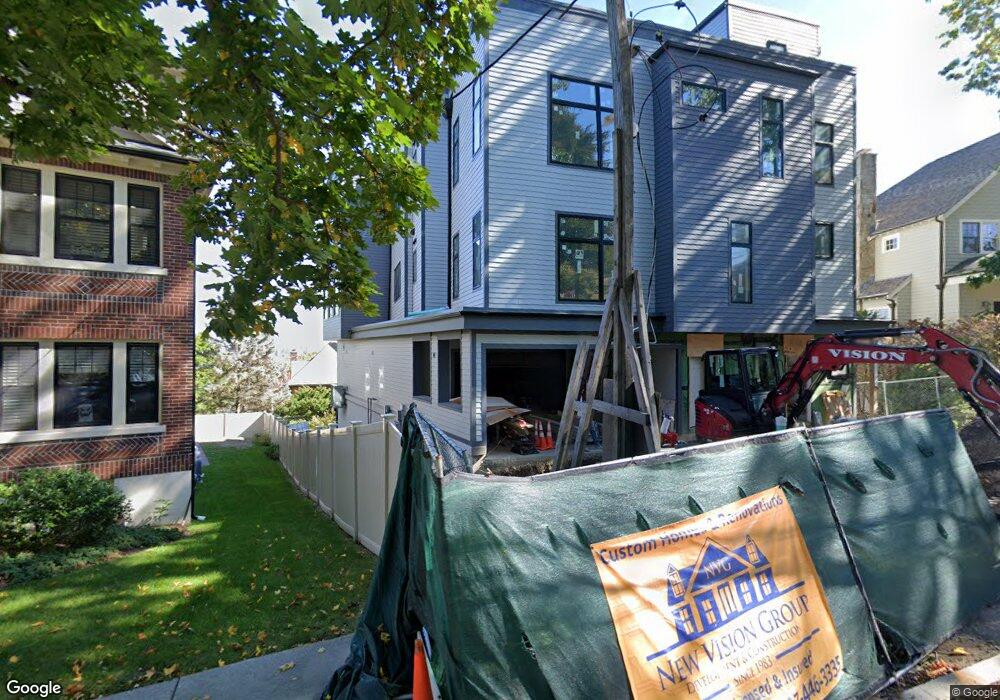
26 Colbourne Crescent Unit 28 Brookline, MA 02445
Washington Square NeighborhoodEstimated Value: $3,017,000 - $3,958,000
2
Beds
1
Bath
1,150
Sq Ft
$3,028/Sq Ft
Est. Value
About This Home
This home is located at 26 Colbourne Crescent Unit 28, Brookline, MA 02445 and is currently estimated at $3,482,252, approximately $3,028 per square foot. 26 Colbourne Crescent Unit 28 is a home located in Norfolk County with nearby schools including John D. Runkle School, Torah Academy, and St. Mary of the Assumption Elementary School.
Ownership History
Date
Name
Owned For
Owner Type
Purchase Details
Closed on
Nov 10, 2023
Sold by
Edelman Alan and Haden Susan
Bought by
Alan S Edelman T S and Alan Edelman
Current Estimated Value
Purchase Details
Closed on
Aug 1, 2023
Sold by
Colbourne Crescent Llc
Bought by
Edelman Alan and Haden Susan
Home Financials for this Owner
Home Financials are based on the most recent Mortgage that was taken out on this home.
Original Mortgage
$2,300,000
Interest Rate
6.13%
Mortgage Type
Purchase Money Mortgage
Purchase Details
Closed on
Apr 30, 2018
Sold by
Grippo Ann J
Bought by
Colbourne Crescent Llc
Home Financials for this Owner
Home Financials are based on the most recent Mortgage that was taken out on this home.
Original Mortgage
$1,275,000
Interest Rate
4.44%
Mortgage Type
Purchase Money Mortgage
Purchase Details
Closed on
Oct 27, 2006
Sold by
Grippo Felice S
Bought by
Grippo Felice S and Grippo Ann J
Create a Home Valuation Report for This Property
The Home Valuation Report is an in-depth analysis detailing your home's value as well as a comparison with similar homes in the area
Home Values in the Area
Average Home Value in this Area
Purchase History
| Date | Buyer | Sale Price | Title Company |
|---|---|---|---|
| Alan S Edelman T S | -- | None Available | |
| Alan S Edelman T S | -- | None Available | |
| Alan S Edelman T S | -- | None Available | |
| Edelman Alan | $3,500,000 | None Available | |
| Edelman Alan | $3,500,000 | None Available | |
| Edelman Alan | $3,500,000 | None Available | |
| Colbourne Crescent Llc | $1,700,000 | -- | |
| Colbourne Crescent Llc | $1,700,000 | -- | |
| Colbourne Crescent Llc | $1,700,000 | -- | |
| Grippo Felice S | -- | -- | |
| Grippo Felice S | -- | -- | |
| Grippo Felice S | -- | -- |
Source: Public Records
Mortgage History
| Date | Status | Borrower | Loan Amount |
|---|---|---|---|
| Previous Owner | Edelman Alan | $2,300,000 | |
| Previous Owner | Colbourne Crescent Llc | $1,275,000 |
Source: Public Records
Tax History Compared to Growth
Tax History
| Year | Tax Paid | Tax Assessment Tax Assessment Total Assessment is a certain percentage of the fair market value that is determined by local assessors to be the total taxable value of land and additions on the property. | Land | Improvement |
|---|---|---|---|---|
| 2025 | $32,065 | $3,248,700 | $0 | $3,248,700 |
| 2024 | $42,361 | $4,335,800 | $1,221,700 | $3,114,100 |
| 2023 | $27,255 | $2,733,700 | $1,010,600 | $1,723,100 |
| 2022 | $11,480 | $1,126,600 | $962,500 | $164,100 |
| 2021 | $9,070 | $925,500 | $925,500 | $0 |
| 2020 | $9,844 | $1,041,700 | $841,400 | $200,300 |
| 2019 | $13,385 | $1,428,500 | $801,300 | $627,200 |
| 2018 | $11,972 | $1,265,500 | $652,400 | $613,100 |
| 2017 | $11,577 | $1,171,800 | $615,500 | $556,300 |
| 2016 | $11,099 | $1,065,200 | $575,200 | $490,000 |
| 2015 | $9,820 | $919,500 | $488,700 | $430,800 |
| 2014 | $9,525 | $836,300 | $444,200 | $392,100 |
Source: Public Records
Map
Nearby Homes
- 15 Colbourne Crescent Unit 2
- 12 Colbourne Crescent Unit 1
- 108-116 Winthrop Rd
- 84 Winthrop Rd Unit 1
- 84 Winthrop Rd
- 90 Addington Rd Unit 1
- 57 University Rd Unit 3
- 648 Washington St Unit 7
- 4 Fairbanks St Unit 2
- 589-591 Washington St
- 255 Tappan St
- 184 Rawson Rd
- 16 Garrison Rd Unit 7
- 87 Greenough St Unit 1
- 87 Greenough St Unit 2
- 71 Greenough St Unit 71-1
- 105 Sumner Rd
- 21 Hancock Rd
- 1572 Beacon St
- 324 Tappan St Unit 1
- 26 Colbourne Crescent Unit 1
- 28 Colbourne Crescent Unit SPECIAL
- 28 Colbourne Crescent Unit 1
- 28 Colbourne Crescent
- 32 Colbourne Crescent
- 22 Colbourne Crescent
- 22 Colbourne Crescent Unit 1
- 34 Colbourne Crescent
- 47 Rawson Rd
- 45 Rawson Rd
- 18 Colbourne Crescent
- 18 Colbourne Crescent Unit 2
- 18 Colbourne Crescent Unit 1
- 9 Rawson Rd
- 7 Rawson Rd Unit 2
- 7 Rawson Rd
- 29 Colbourne Crescent
- 21 Colbourne Crescent
- 21 Colbourne Crescent Unit 2
- 36 Colbourne Crescent