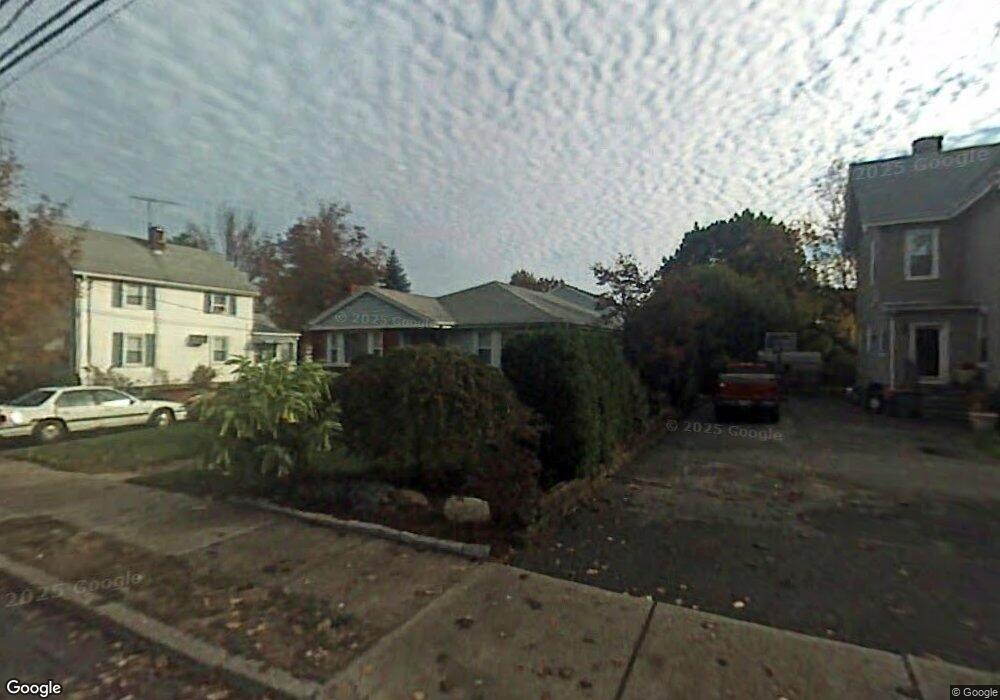
26 Elm St West Newton, MA 02465
West Newton NeighborhoodEstimated Value: $900,000 - $1,025,143
3
Beds
2
Baths
1,186
Sq Ft
$823/Sq Ft
Est. Value
About This Home
This home is located at 26 Elm St, West Newton, MA 02465 and is currently estimated at $976,286, approximately $823 per square foot. 26 Elm St is a home located in Middlesex County with nearby schools including Franklin Elementary School, C.C. Burr, and F.A. Day Middle School.
Ownership History
Date
Name
Owned For
Owner Type
Purchase Details
Closed on
Apr 7, 2025
Sold by
Butera Maria
Bought by
Maria Butera 2009 Ret and Butera
Current Estimated Value
Create a Home Valuation Report for This Property
The Home Valuation Report is an in-depth analysis detailing your home's value as well as a comparison with similar homes in the area
Home Values in the Area
Average Home Value in this Area
Purchase History
| Date | Buyer | Sale Price | Title Company |
|---|---|---|---|
| Maria Butera 2009 Ret | -- | None Available |
Source: Public Records
Tax History Compared to Growth
Tax History
| Year | Tax Paid | Tax Assessment Tax Assessment Total Assessment is a certain percentage of the fair market value that is determined by local assessors to be the total taxable value of land and additions on the property. | Land | Improvement |
|---|---|---|---|---|
| 2025 | $7,583 | $773,800 | $691,900 | $81,900 |
| 2024 | $7,333 | $751,300 | $671,700 | $79,600 |
| 2023 | $7,001 | $687,700 | $512,000 | $175,700 |
| 2022 | $6,699 | $636,800 | $474,100 | $162,700 |
| 2021 | $6,465 | $600,800 | $447,300 | $153,500 |
| 2020 | $6,272 | $600,800 | $447,300 | $153,500 |
| 2019 | $6,095 | $583,300 | $434,300 | $149,000 |
| 2018 | $5,915 | $546,700 | $393,900 | $152,800 |
| 2017 | $5,736 | $515,800 | $371,600 | $144,200 |
| 2016 | $5,486 | $482,100 | $347,300 | $134,800 |
| 2015 | $5,231 | $450,600 | $324,600 | $126,000 |
Source: Public Records
Map
Nearby Homes
- 371 Cherry St
- 2 Elm St Unit 6
- 2 Elm St Unit 8
- 106 River St Unit 18
- 106 River St Unit 2
- 106 River St Unit 14
- 66 Webster St
- 429 Cherry St Unit 11
- 287 Cherry St Unit 2
- 41 Kilburn Rd
- 44 Westland Ave
- 56 Dearborn St
- 42 Evergreen Cir
- 90 Auburndale Ave
- 212 River St Unit 2
- 53-55 N Gate Park
- 79 Chestnut St Unit 2
- 12 Inis Cir
- 1488 Washington St Unit 1488
- 10 Crescent St Unit 1