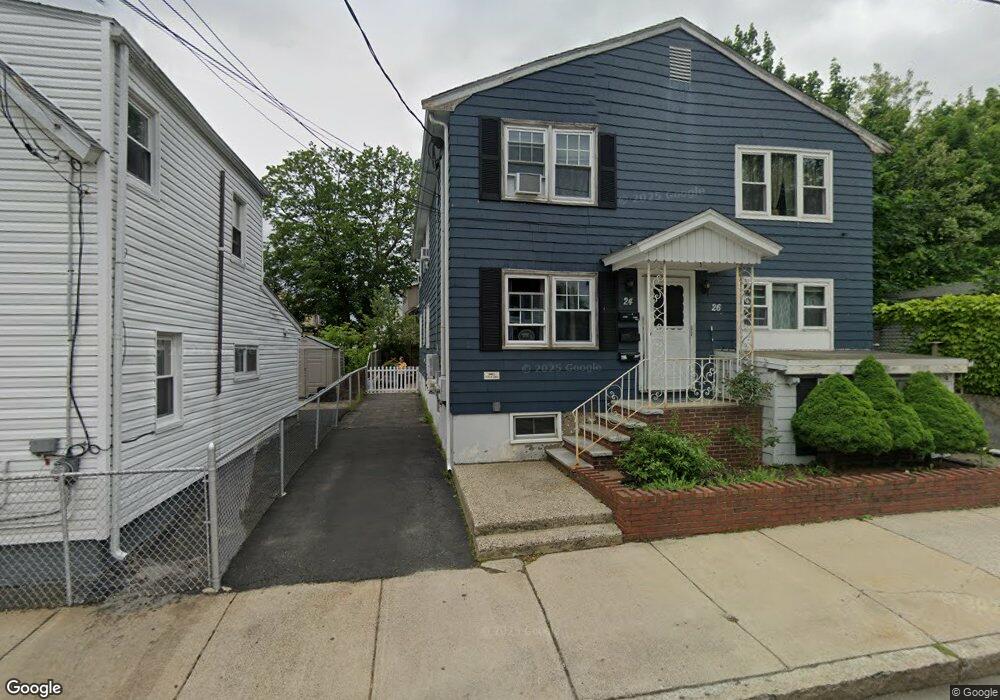
26 George St Everett, MA 02149
Glendale NeighborhoodEstimated Value: $704,699 - $1,063,000
11
Beds
3
Baths
2,456
Sq Ft
$376/Sq Ft
Est. Value
About This Home
This home is located at 26 George St, Everett, MA 02149 and is currently estimated at $923,675, approximately $376 per square foot. 26 George St is a home located in Middlesex County with nearby schools including Everett High School, Pioneer Charter School of Science, and St Anthony School.
Ownership History
Date
Name
Owned For
Owner Type
Purchase Details
Closed on
Apr 22, 2009
Sold by
Dacosta Francisco
Bought by
Saravia Sergio
Current Estimated Value
Home Financials for this Owner
Home Financials are based on the most recent Mortgage that was taken out on this home.
Original Mortgage
$235,000
Outstanding Balance
$148,478
Interest Rate
4.93%
Mortgage Type
Purchase Money Mortgage
Estimated Equity
$775,197
Purchase Details
Closed on
Nov 7, 2008
Sold by
Dacosta Francisco and Locke Leo
Bought by
Dacosta Francisco
Purchase Details
Closed on
Jan 22, 2004
Sold by
Dacosta Francisco
Bought by
Dacosta Francisco and Locke Leo
Purchase Details
Closed on
Sep 2, 2003
Sold by
Bono Bernadette J and Bono Leonard G
Bought by
Dacosta Francisco
Home Financials for this Owner
Home Financials are based on the most recent Mortgage that was taken out on this home.
Original Mortgage
$424,000
Interest Rate
5.69%
Mortgage Type
Purchase Money Mortgage
Create a Home Valuation Report for This Property
The Home Valuation Report is an in-depth analysis detailing your home's value as well as a comparison with similar homes in the area
Home Values in the Area
Average Home Value in this Area
Purchase History
| Date | Buyer | Sale Price | Title Company |
|---|---|---|---|
| Saravia Sergio | $310,000 | -- | |
| Dacosta Francisco | -- | -- | |
| Dacosta Francisco | -- | -- | |
| Dacosta Francisco | $538,750 | -- |
Source: Public Records
Mortgage History
| Date | Status | Borrower | Loan Amount |
|---|---|---|---|
| Open | Saravia Sergio | $235,000 | |
| Previous Owner | Dacosta Francisco | $424,000 |
Source: Public Records
Tax History
| Year | Tax Paid | Tax Assessment Tax Assessment Total Assessment is a certain percentage of the fair market value that is determined by local assessors to be the total taxable value of land and additions on the property. | Land | Improvement |
|---|---|---|---|---|
| 2025 | $9,442 | $829,000 | $247,400 | $581,600 |
| 2024 | $8,760 | $764,400 | $226,200 | $538,200 |
| 2023 | $8,642 | $733,600 | $216,800 | $516,800 |
| 2022 | $7,083 | $683,700 | $197,900 | $485,800 |
| 2021 | $6,296 | $637,900 | $167,300 | $470,600 |
| 2020 | $6,440 | $605,300 | $167,300 | $438,000 |
| 2019 | $6,904 | $557,700 | $156,000 | $401,700 |
| 2018 | $6,539 | $474,500 | $135,700 | $338,800 |
| 2017 | $6,036 | $418,000 | $103,700 | $314,300 |
| 2016 | $5,556 | $384,500 | $103,000 | $281,500 |
| 2015 | $5,279 | $361,300 | $89,500 | $271,800 |
Source: Public Records
Map
Nearby Homes
- 105 Summer St
- 110 Ferry St
- 121 Cottage St
- 20 Ferry St Unit B
- 37 Argyle St
- 56 Mansfield St
- 181 Chelsea St
- 20 Derne St
- 11 Hampshire St
- 148 Florence St
- 7 Hampshire St
- 18 Winter St
- 238 Chelsea St
- 30 Woodlawn St
- 40 Baker Rd
- 30 Chelsea St Unit 210
- 114 Francis St
- 44-46 Cabot St
- 55 Garland St
- 12 Hamilton St Unit 8
Your Personal Tour Guide
Ask me questions while you tour the home.