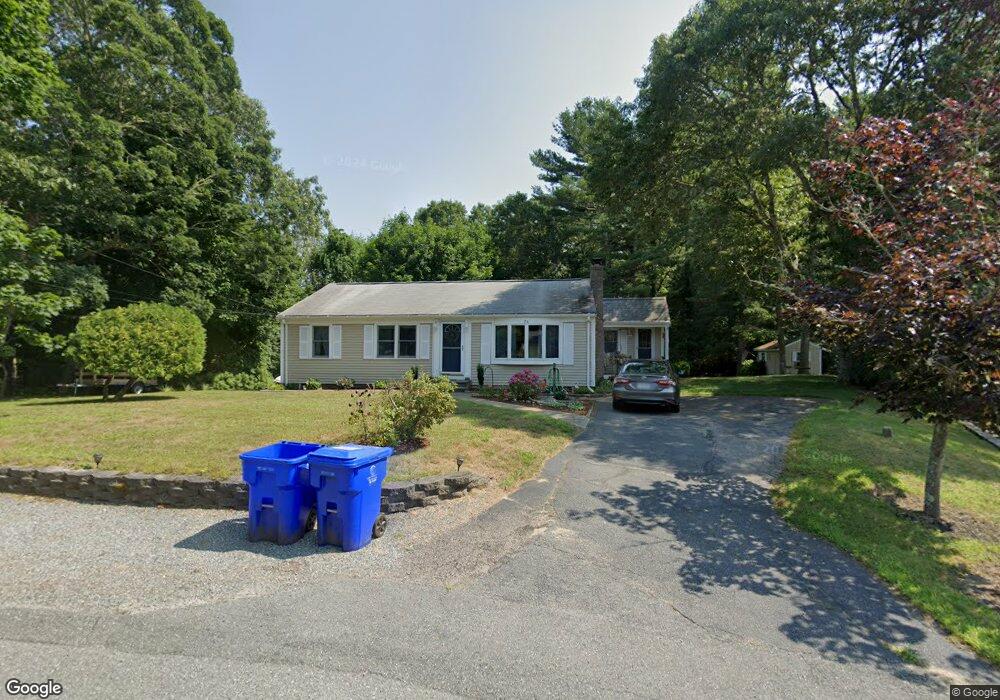
26 Millbrook Rd Bourne, MA 2532
Monument Beach NeighborhoodEstimated Value: $578,872 - $629,000
3
Beds
2
Baths
1,688
Sq Ft
$353/Sq Ft
Est. Value
About This Home
This home is located at 26 Millbrook Rd, Bourne, MA 2532 and is currently estimated at $596,218, approximately $353 per square foot. 26 Millbrook Rd is a home located in Barnstable County with nearby schools including Bourne High School, St Margaret Regional School, and Cadence Academy Preschool - Bourne.
Ownership History
Date
Name
Owned For
Owner Type
Purchase Details
Closed on
Mar 1, 1995
Sold by
Ward Donald R and Ward Monique L
Bought by
Vicino John J and Vicino Janet L
Current Estimated Value
Purchase Details
Closed on
Aug 8, 1994
Sold by
Campano Robert A and Holmgren Michael W
Bought by
Ward Donald F and Ward Monique L
Purchase Details
Closed on
Feb 1, 1991
Sold by
Realty Funding Corp
Bought by
Campano Robert A and Holmgren Michael W
Purchase Details
Closed on
Oct 25, 1989
Sold by
Swift Douglas S
Bought by
Realty Funding Corp
Create a Home Valuation Report for This Property
The Home Valuation Report is an in-depth analysis detailing your home's value as well as a comparison with similar homes in the area
Home Values in the Area
Average Home Value in this Area
Purchase History
| Date | Buyer | Sale Price | Title Company |
|---|---|---|---|
| Vicino John J | $105,000 | -- | |
| Vicino John J | $105,000 | -- | |
| Ward Donald F | $70,000 | -- | |
| Ward Donald F | $70,000 | -- | |
| Campano Robert A | $119,900 | -- | |
| Campano Robert A | $119,900 | -- | |
| Realty Funding Corp | $30,000 | -- | |
| Realty Funding Corp | $30,000 | -- |
Source: Public Records
Mortgage History
| Date | Status | Borrower | Loan Amount |
|---|---|---|---|
| Closed | Realty Funding Corp | $139,000 | |
| Closed | Realty Funding Corp | $187,150 |
Source: Public Records
Tax History
| Year | Tax Paid | Tax Assessment Tax Assessment Total Assessment is a certain percentage of the fair market value that is determined by local assessors to be the total taxable value of land and additions on the property. | Land | Improvement |
|---|---|---|---|---|
| 2025 | $4,089 | $523,600 | $184,100 | $339,500 |
| 2024 | $3,998 | $498,500 | $175,300 | $323,200 |
| 2023 | $3,887 | $441,200 | $155,200 | $286,000 |
| 2022 | $3,705 | $367,200 | $137,300 | $229,900 |
| 2021 | $3,600 | $334,300 | $125,000 | $209,300 |
| 2020 | $3,372 | $314,000 | $123,800 | $190,200 |
| 2019 | $3,188 | $303,300 | $123,800 | $179,500 |
| 2018 | $2,974 | $282,200 | $117,900 | $164,300 |
| 2017 | $2,621 | $254,500 | $110,900 | $143,600 |
| 2016 | $2,558 | $251,800 | $110,900 | $140,900 |
| 2015 | $2,419 | $240,200 | $99,300 | $140,900 |
Source: Public Records
Map
Nearby Homes
- 203 County Rd
- 16 Amberwood Ct
- 13 Laurel Hill Ct
- 12 Turnberry Rd Unit 12
- 5 Sea Knoll Ct
- 4 Harbor Hill Dr
- 4 Hollyhock Knoll Ct Unit 4
- 4 Hollyhock Knoll Ct Unit 4
- 5 Zoli Ln
- 20 Colony Ave
- 566 Shore Rd
- 35 Benedict Rd
- 44 Cotuit Rd
- 10 Sandy Ln
- 60 Sandwich Rd
- 60 Bourne Neck Dr
- 46 Holt Rd Unit B
- 46 Holt Rd
- 38 Old Bridge Rd
- 3 Honora Ln Unit 3
Your Personal Tour Guide
Ask me questions while you tour the home.