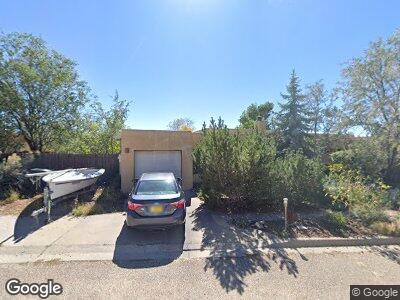
2601 Sol Y Luz Loop Santa Fe, NM 87505
Estimated Value: $385,000 - $464,000
3
Beds
1
Bath
1,004
Sq Ft
$411/Sq Ft
Est. Value
About This Home
This home is located at 2601 Sol Y Luz Loop, Santa Fe, NM 87505 and is currently estimated at $412,434, approximately $410 per square foot. 2601 Sol Y Luz Loop is a home located in Santa Fe County with nearby schools including Francis X. Nava Elementary School, Milagro Middle School, and Santa Fe High School.
Ownership History
Date
Name
Owned For
Owner Type
Purchase Details
Closed on
Jun 25, 1998
Sold by
Fong Stephen C and Fong Michaela M
Bought by
Ohare Craig D
Current Estimated Value
Home Financials for this Owner
Home Financials are based on the most recent Mortgage that was taken out on this home.
Original Mortgage
$100,000
Interest Rate
7.21%
Create a Home Valuation Report for This Property
The Home Valuation Report is an in-depth analysis detailing your home's value as well as a comparison with similar homes in the area
Home Values in the Area
Average Home Value in this Area
Purchase History
| Date | Buyer | Sale Price | Title Company |
|---|---|---|---|
| Ohare Craig D | -- | -- |
Source: Public Records
Mortgage History
| Date | Status | Borrower | Loan Amount |
|---|---|---|---|
| Closed | Ohare Craig D | $100,000 |
Source: Public Records
Tax History Compared to Growth
Tax History
| Year | Tax Paid | Tax Assessment Tax Assessment Total Assessment is a certain percentage of the fair market value that is determined by local assessors to be the total taxable value of land and additions on the property. | Land | Improvement |
|---|---|---|---|---|
| 2024 | $1,287 | $174,860 | $59,701 | $115,159 |
| 2023 | $1,285 | $169,768 | $57,963 | $111,805 |
| 2022 | $1,256 | $164,824 | $56,275 | $108,549 |
| 2021 | $1,235 | $53,341 | $18,211 | $35,130 |
| 2020 | $1,196 | $51,788 | $17,681 | $34,107 |
| 2019 | $1,178 | $50,280 | $17,166 | $33,114 |
| 2018 | $1,151 | $48,815 | $16,666 | $32,149 |
| 2017 | $1,121 | $47,394 | $16,666 | $30,728 |
| 2016 | $1,055 | $46,014 | $16,667 | $29,347 |
| 2015 | $1,029 | $44,674 | $16,667 | $28,007 |
| 2014 | $1,045 | $44,689 | $16,650 | $28,039 |
Source: Public Records
Map
Nearby Homes
- 2317 Camino Rancho Siringo
- 2730 Calle Anna Jean Unit D
- 2237 Paseo de Los Chamisos
- 2367 Camino Pintores
- 2606 Alamosa Dr
- 996 Camino Rizo
- 2600 W Zia Rd Unit E5-7
- 1013 Camino Carlos Rey
- 2746 Calle Serena
- 1021 Camino Carlos Rey
- 2501 W Zia Rd Unit 11-104
- 2501 W Zia Rd Unit 103/1
- 2501 W Zia Rd Unit 10-111
- 2501 W Zia Rd Unit 10-210
- 2839 Plaza Amarilla
- 988 Avenida de Las Campanas
- 1007 Calle la Resolana
- 2530 Calle Delfino
- 1020 Calle de Suenos
- 1556 Escondida Ct
- 2601 Sol Y Luz Loop
- 2605 Sol Y Luz Loop
- 2309 Camino Rancho Siringo
- 2632 Sol Y Luz Loop
- 2636 Sol Y Luz Loop
- 2628 Sol Y Luz Loop
- 2609 Sol Y Luz Loop
- 2308 Camino Rancho Siringo
- 2304 Camino Rancho Siringo
- 2300 Camino Rancho Siringo
- 2312 Camino Rancho Siringo
- 2313 Camino Rancho Siringo
- 2633 Sol Y Luz Loop
- 2637 Sol Y Luz Loop
- 2625 Sol Y Luz Loop
- 2357 Camino Pintores
- 2316 Camino Rancho Siringo
- 2355 Camino Pintores
- 2359 Camino Pintores
- 2701 Sol Y Luz Loop