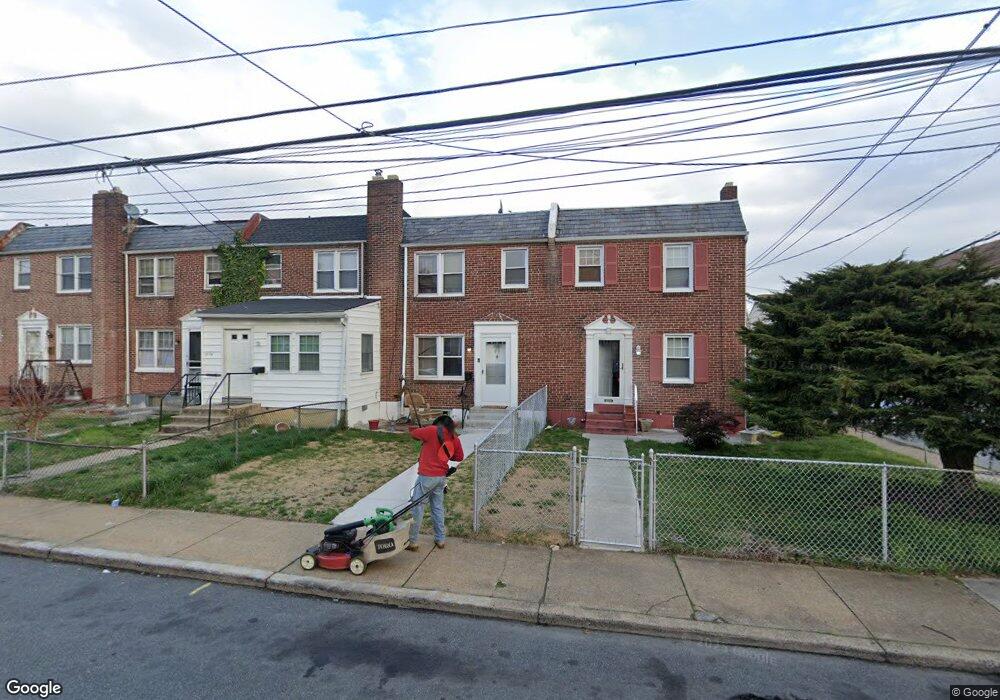
2602 Jessup St Wilmington, DE 19802
Eastlake NeighborhoodEstimated Value: $133,472 - $171,000
3
Beds
1
Bath
1,080
Sq Ft
$134/Sq Ft
Est. Value
About This Home
This home is located at 2602 Jessup St, Wilmington, DE 19802 and is currently estimated at $144,868, approximately $134 per square foot. 2602 Jessup St is a home located in New Castle County with nearby schools including Carrcroft Elementary School, Springer Middle School, and Mount Pleasant High School.
Ownership History
Date
Name
Owned For
Owner Type
Purchase Details
Closed on
Sep 29, 2016
Sold by
1218 Caln Property Llc
Bought by
Scented Lights Inc
Current Estimated Value
Purchase Details
Closed on
Oct 11, 2006
Sold by
One Pie Investments Llc
Bought by
1218 Caln Property Llc
Purchase Details
Closed on
Oct 6, 2006
Sold by
Federal National Mortgage Association
Bought by
One Pie Investments Llc
Purchase Details
Closed on
Jan 3, 2006
Sold by
Cornish Sherman and Bryant Ursula
Bought by
Federal National Mortgage Association
Create a Home Valuation Report for This Property
The Home Valuation Report is an in-depth analysis detailing your home's value as well as a comparison with similar homes in the area
Home Values in the Area
Average Home Value in this Area
Purchase History
| Date | Buyer | Sale Price | Title Company |
|---|---|---|---|
| Scented Lights Inc | -- | None Available | |
| 1218 Caln Property Llc | $44,100 | None Available | |
| One Pie Investments Llc | $44,100 | None Available | |
| Federal National Mortgage Association | $85,000 | None Available |
Source: Public Records
Tax History Compared to Growth
Tax History
| Year | Tax Paid | Tax Assessment Tax Assessment Total Assessment is a certain percentage of the fair market value that is determined by local assessors to be the total taxable value of land and additions on the property. | Land | Improvement |
|---|---|---|---|---|
| 2024 | $724 | $22,400 | $2,800 | $19,600 |
| 2023 | $657 | $22,400 | $2,800 | $19,600 |
| 2022 | $664 | $22,400 | $2,800 | $19,600 |
| 2021 | $4,108 | $22,400 | $2,800 | $19,600 |
| 2020 | $775 | $22,400 | $2,800 | $19,600 |
| 2019 | $1,115 | $22,400 | $2,800 | $19,600 |
| 2018 | $643 | $22,400 | $2,800 | $19,600 |
| 2017 | $638 | $22,400 | $2,800 | $19,600 |
| 2016 | $637 | $22,400 | $2,800 | $19,600 |
| 2015 | $994 | $22,400 | $2,800 | $19,600 |
| 2014 | $994 | $22,400 | $2,800 | $19,600 |
Source: Public Records
Map
Nearby Homes