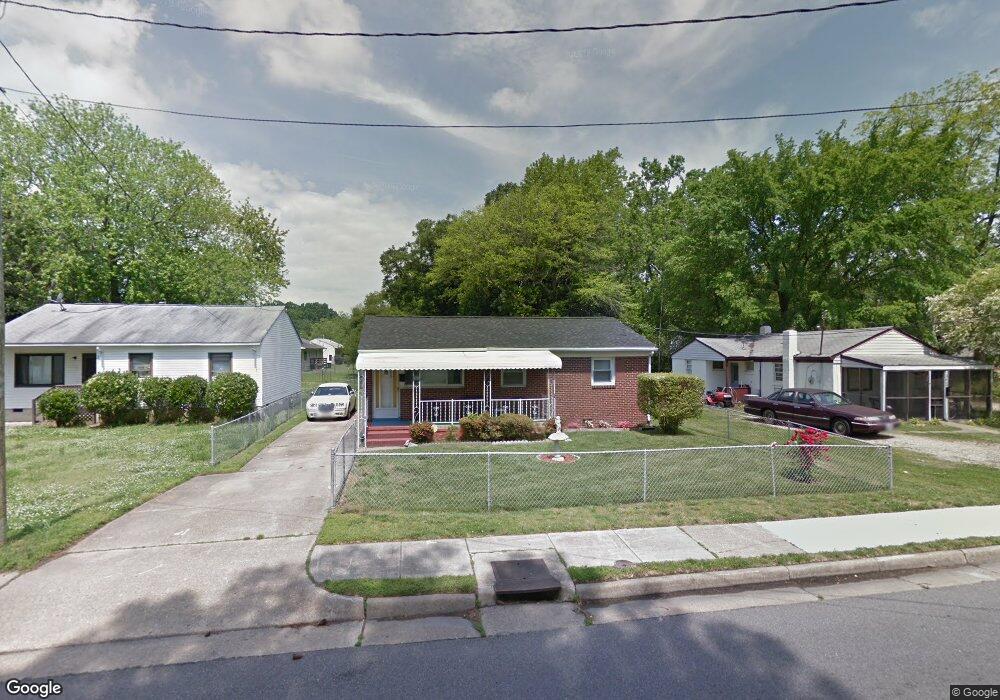
2603 Shell Rd Hampton, VA 23661
Wythe NeighborhoodEstimated Value: $92,000 - $236,000
3
Beds
2
Baths
1,179
Sq Ft
$162/Sq Ft
Est. Value
About This Home
This home is located at 2603 Shell Rd, Hampton, VA 23661 and is currently estimated at $190,550, approximately $161 per square foot. 2603 Shell Rd is a home located in Hampton City with nearby schools including Bassette Elementary School, C. Alton Lindsay Middle School, and Hampton High School.
Ownership History
Date
Name
Owned For
Owner Type
Purchase Details
Closed on
Sep 29, 2022
Sold by
Okobi Judith
Bought by
Okobi Judith and Okobi Chika Henry
Current Estimated Value
Home Financials for this Owner
Home Financials are based on the most recent Mortgage that was taken out on this home.
Original Mortgage
$181,242
Interest Rate
4%
Mortgage Type
Construction
Purchase Details
Closed on
Aug 11, 2022
Sold by
Domineck Elmer E
Bought by
Okobl Judith
Home Financials for this Owner
Home Financials are based on the most recent Mortgage that was taken out on this home.
Original Mortgage
$181,242
Interest Rate
4%
Mortgage Type
Construction
Create a Home Valuation Report for This Property
The Home Valuation Report is an in-depth analysis detailing your home's value as well as a comparison with similar homes in the area
Home Values in the Area
Average Home Value in this Area
Purchase History
| Date | Buyer | Sale Price | Title Company |
|---|---|---|---|
| Okobi Judith | -- | Linear Title | |
| Okobl Judith | $187,500 | None Listed On Document |
Source: Public Records
Mortgage History
| Date | Status | Borrower | Loan Amount |
|---|---|---|---|
| Previous Owner | Okobl Judith | $181,242 |
Source: Public Records
Tax History
| Year | Tax Paid | Tax Assessment Tax Assessment Total Assessment is a certain percentage of the fair market value that is determined by local assessors to be the total taxable value of land and additions on the property. | Land | Improvement |
|---|---|---|---|---|
| 2025 | $2,465 | $207,500 | $43,700 | $163,800 |
| 2024 | $2,268 | $197,200 | $43,700 | $153,500 |
| 2023 | $2,290 | $185,200 | $43,700 | $141,500 |
| 2022 | $1,513 | $128,200 | $38,800 | $89,400 |
| 2021 | $3,435 | $117,700 | $33,000 | $84,700 |
| 2020 | $1,464 | $118,100 | $31,000 | $87,100 |
| 2019 | $1,140 | $91,900 | $16,600 | $75,300 |
| 2018 | $1,234 | $91,900 | $16,600 | $75,300 |
| 2017 | $1,234 | $0 | $0 | $0 |
| 2016 | $1,234 | $91,900 | $0 | $0 |
| 2015 | $1,234 | $0 | $0 | $0 |
| 2014 | $1,223 | $91,900 | $16,600 | $75,300 |
Source: Public Records
Map
Nearby Homes
Your Personal Tour Guide
Ask me questions while you tour the home.