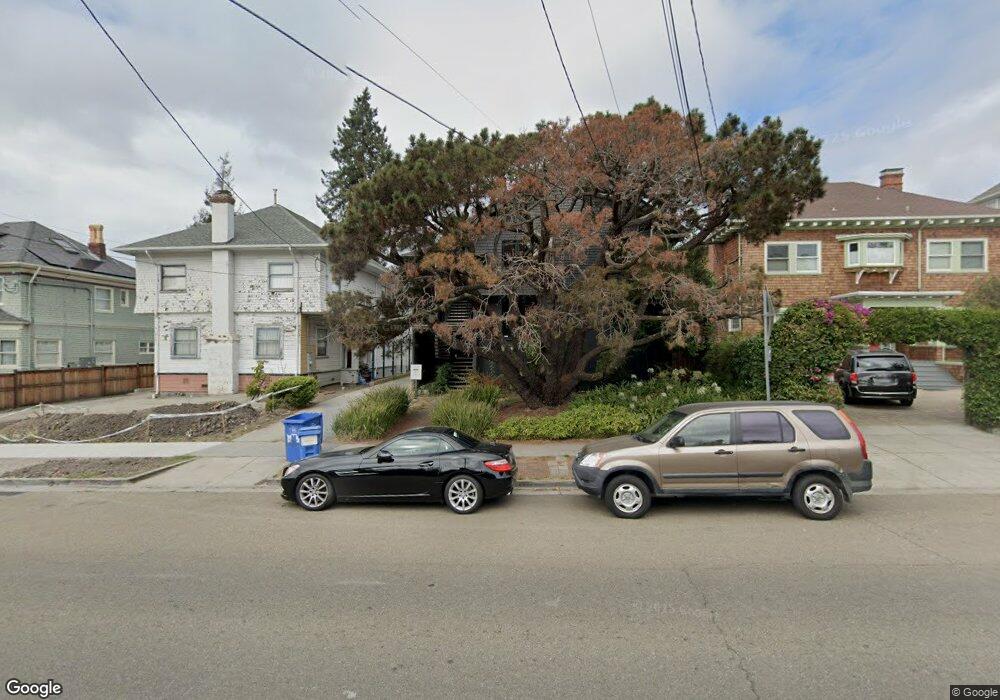
2615 Ashby Ave Berkeley, CA 94705
Elmwood NeighborhoodEstimated Value: $1,413,574
Studio
2
Baths
2,532
Sq Ft
$558/Sq Ft
Est. Value
About This Home
This home is located at 2615 Ashby Ave, Berkeley, CA 94705 and is currently estimated at $1,413,574, approximately $558 per square foot. 2615 Ashby Ave is a home located in Alameda County with nearby schools including Emerson Elementary School, John Muir Elementary School, and Malcolm X Elementary School.
Ownership History
Date
Name
Owned For
Owner Type
Purchase Details
Closed on
Feb 22, 2024
Sold by
Marti Lee Kennedy Revocable 2008 Trust and Kennedy Marti Lee
Bought by
Roikhen Llc
Current Estimated Value
Home Financials for this Owner
Home Financials are based on the most recent Mortgage that was taken out on this home.
Original Mortgage
$1,015,000
Outstanding Balance
$998,016
Interest Rate
6.9%
Mortgage Type
New Conventional
Estimated Equity
$415,558
Purchase Details
Closed on
Jun 13, 2008
Sold by
Kennedy Marti L
Bought by
Kennedy Marti Lee and The Marti Lee Kennedy Revocabl
Purchase Details
Closed on
Apr 19, 2005
Sold by
Gunther Ellen and Ellen Gunther Living Trust
Bought by
Kennedy Marti L
Home Financials for this Owner
Home Financials are based on the most recent Mortgage that was taken out on this home.
Original Mortgage
$560,000
Interest Rate
5.92%
Mortgage Type
Commercial
Create a Home Valuation Report for This Property
The Home Valuation Report is an in-depth analysis detailing your home's value as well as a comparison with similar homes in the area
Home Values in the Area
Average Home Value in this Area
Purchase History
| Date | Buyer | Sale Price | Title Company |
|---|---|---|---|
| Roikhen Llc | $1,512,500 | Old Republic Title Company | |
| Kennedy Marti Lee | -- | None Available | |
| Kennedy Marti L | $925,500 | Old Republic Title Company |
Source: Public Records
Mortgage History
| Date | Status | Borrower | Loan Amount |
|---|---|---|---|
| Open | Roikhen Llc | $1,015,000 | |
| Previous Owner | Kennedy Marti L | $560,000 |
Source: Public Records
Tax History
| Year | Tax Paid | Tax Assessment Tax Assessment Total Assessment is a certain percentage of the fair market value that is determined by local assessors to be the total taxable value of land and additions on the property. | Land | Improvement |
|---|---|---|---|---|
| 2025 | $20,733 | $1,542,750 | $494,700 | $1,048,050 |
| 2024 | $20,733 | $1,264,658 | $409,938 | $854,720 |
| 2023 | $20,300 | $1,239,864 | $401,901 | $837,963 |
| 2022 | $19,919 | $1,215,560 | $394,023 | $821,537 |
| 2021 | $19,933 | $1,191,729 | $386,298 | $805,431 |
| 2020 | $18,842 | $1,179,512 | $382,338 | $797,174 |
| 2019 | $18,190 | $1,156,393 | $374,844 | $781,549 |
| 2018 | $17,872 | $1,133,728 | $367,497 | $766,231 |
| 2017 | $17,249 | $1,111,506 | $360,294 | $751,212 |
| 2016 | $17,098 | $1,089,720 | $353,232 | $736,488 |
| 2015 | $16,862 | $1,073,357 | $347,928 | $725,429 |
| 2014 | $16,771 | $1,052,339 | $341,115 | $711,224 |
Source: Public Records
Map
Nearby Homes
- 2935 Florence St
- 2643 Stuart St
- 2962 Piedmont Ave
- 2477 Prince St
- 2917 Telegraph Ave
- 2817 Palm Ct
- 6446 Colby St
- 2243 Ashby Ave
- 2702 Dana St
- 360 Alcatraz Ave
- 2319 Ward St
- 2632 Warring St Unit 2
- 2601 College Ave Unit 203
- 2601 College Ave Unit 208
- 3046 Deakin St
- 2535 Chilton Way
- 2923 Wheeler St
- 2550 Dana St Unit 2F
- 2509 Dwight Way
- 2110 Ashby Ave
- 2619 Ashby Ave
- 2611 Ashby Ave
- 2623 Ashby Ave
- 2605 Ashby Ave
- 2924 Benvenue Ave
- 2926 Benvenue Ave
- 2928 Benvenue Ave
- 2925 Hillegass Ave
- 2920 Benvenue Ave
- 2933 Hillegass Ave
- 2937 Hillegass Ave Unit 2Bdrm in Elmwood Ber
- 2929 Hillegass Ave
- 2921 Hillegass Ave
- 2616 Ashby Ave
- 2612 Ashby Ave
- 2608 Ashby Ave
- 2600 Ashby Ave Unit 1
- 2600 Ashby Ave Unit 4
- 2600 Ashby Ave Unit 2
- 2933 Benvenue Ave
Your Personal Tour Guide
Ask me questions while you tour the home.