
Seller's Agent in 2021
Leesa Hammond
Real Brokerage Technologies
(310) 890-4439
2 in this area
19 Total Sales
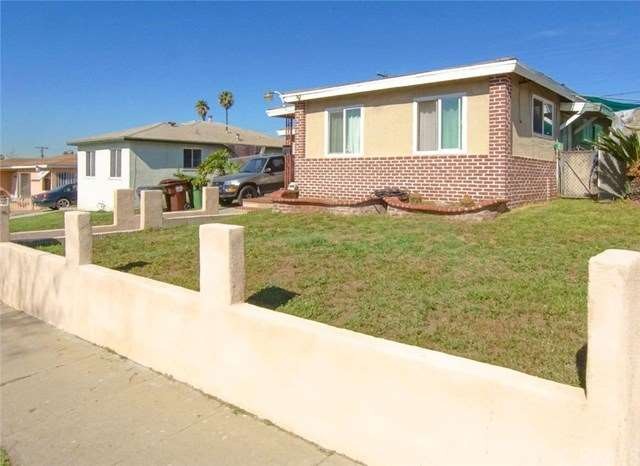

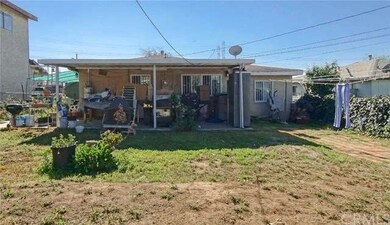
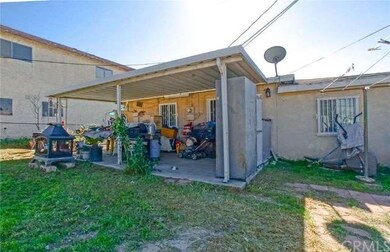
This home is located at 2615 W Lantana St, Compton, CA 90220 and is currently priced at $285,000, approximately $350 per square foot. This property was built in 1953. 2615 W Lantana St is a home located in Los Angeles County with nearby schools including Ralph Bunche Elementary School, Enterprise Middle School, and Compton High School.
Last Agent to Sell the Property
Silvestre Madrigal
Express Realty & Investments License #01363650 Listed on: 02/18/2016
Last Buyer's Agent
Silvestre Madrigal
Express Realty & Investments License #01363650 Listed on: 02/18/2016
| Date | Type | Sale Price | Title Company |
|---|---|---|---|
| Quit Claim Deed | -- | New Title Company Name | |
| Grant Deed | $540,000 | New Title Company Name | |
| Grant Deed | $285,000 | Pacific Coast Title Company | |
| Grant Deed | $130,000 | Ticor Title Co | |
| Grant Deed | $85,000 | American Title Co | |
| Trustee Deed | $90,722 | -- |
| Date | Status | Loan Amount | Loan Type |
|---|---|---|---|
| Open | $513,000 | New Conventional | |
| Previous Owner | $270,750 | New Conventional | |
| Previous Owner | $103,800 | New Conventional | |
| Previous Owner | $84,300 | FHA |
| Date | Event | Price | Change | Sq Ft Price |
|---|---|---|---|---|
| 09/24/2021 09/24/21 | Sold | $540,000 | +8.0% | $665 / Sq Ft |
| 08/27/2021 08/27/21 | Pending | -- | -- | -- |
| 08/27/2021 08/27/21 | For Sale | $500,000 | -7.4% | $616 / Sq Ft |
| 08/26/2021 08/26/21 | Off Market | $540,000 | -- | -- |
| 08/24/2021 08/24/21 | For Sale | $500,000 | -7.4% | $616 / Sq Ft |
| 08/18/2021 08/18/21 | Off Market | $540,000 | -- | -- |
| 08/18/2021 08/18/21 | For Sale | $500,000 | -7.4% | $616 / Sq Ft |
| 08/17/2021 08/17/21 | Off Market | $540,000 | -- | -- |
| 08/12/2021 08/12/21 | For Sale | $500,000 | +75.4% | $616 / Sq Ft |
| 05/04/2016 05/04/16 | Sold | $285,000 | +1.8% | $351 / Sq Ft |
| 02/24/2016 02/24/16 | Pending | -- | -- | -- |
| 02/18/2016 02/18/16 | For Sale | $279,900 | +86.6% | $345 / Sq Ft |
| 12/31/2012 12/31/12 | Sold | $150,000 | 0.0% | $185 / Sq Ft |
| 11/16/2012 11/16/12 | Pending | -- | -- | -- |
| 11/16/2012 11/16/12 | For Sale | $150,000 | +40.2% | $185 / Sq Ft |
| 06/30/2012 06/30/12 | Sold | $107,000 | -28.7% | $132 / Sq Ft |
| 04/01/2012 04/01/12 | Pending | -- | -- | -- |
| 03/16/2012 03/16/12 | Price Changed | $150,000 | -9.1% | $185 / Sq Ft |
| 03/08/2012 03/08/12 | For Sale | $165,000 | -- | $203 / Sq Ft |
| Year | Tax Paid | Tax Assessment Tax Assessment Total Assessment is a certain percentage of the fair market value that is determined by local assessors to be the total taxable value of land and additions on the property. | Land | Improvement |
|---|---|---|---|---|
| 2025 | $10,029 | $573,050 | $429,151 | $143,899 |
| 2024 | $10,029 | $561,815 | $420,737 | $141,078 |
| 2023 | $9,902 | $550,800 | $412,488 | $138,312 |
| 2022 | $9,320 | $540,000 | $404,400 | $135,600 |
| 2021 | $5,581 | $311,686 | $212,713 | $98,973 |
| 2019 | $5,712 | $302,443 | $206,404 | $96,039 |
| 2018 | $5,577 | $296,513 | $202,357 | $94,156 |
| 2017 | $5,407 | $290,700 | $198,390 | $92,310 |
| 2016 | $2,884 | $134,915 | $107,975 | $26,940 |
| 2015 | $2,764 | $132,890 | $106,354 | $26,536 |
| 2014 | $2,720 | $130,288 | $104,271 | $26,017 |
Seller's Agent in 2021
Leesa Hammond
Real Brokerage Technologies
(310) 890-4439
2 in this area
19 Total Sales
J
Buyer's Agent in 2021
Jacquelin Sandoval
Maxximum Realty Inc
(714) 442-1406
1 in this area
12 Total Sales
S
Seller's Agent in 2016
Silvestre Madrigal
Express Realty & Investments
N
Buyer's Agent in 2012
NoEmail NoEmail
NONMEMBER MRML
(646) 541-2551
13 in this area
5,928 Total Sales
Source: California Regional Multiple Listing Service (CRMLS)
MLS Number: DW16034048
APN: 6140-015-022
Disclaimer: Certain information contained herein is derived from information provided by parties other than Homes.com. All information provided is deemed reliable, but is not guaranteed to be accurate and should be independently verified.
![]() The multiple listing data appearing on this website, or contained in reports produced therefrom, is owned and copyrighted by California Regional Multiple Listing Service, Inc. ("CRMLS") and is protected by all applicable copyright laws. Information provided is for viewer's personal, non-commercial use and may not be used for any purpose other than to identify prospective properties the viewer may be interested in purchasing. All listing data, including but not limited to square footage and lot size is believed to be accurate, but the listing Agent, listing Broker and CRMLS and its affiliates do not warrant or guarantee such accuracy. The viewer should independently verify the listed data prior to making any decisions based on such information by personal inspection and/or contacting a real estate professional.
The multiple listing data appearing on this website, or contained in reports produced therefrom, is owned and copyrighted by California Regional Multiple Listing Service, Inc. ("CRMLS") and is protected by all applicable copyright laws. Information provided is for viewer's personal, non-commercial use and may not be used for any purpose other than to identify prospective properties the viewer may be interested in purchasing. All listing data, including but not limited to square footage and lot size is believed to be accurate, but the listing Agent, listing Broker and CRMLS and its affiliates do not warrant or guarantee such accuracy. The viewer should independently verify the listed data prior to making any decisions based on such information by personal inspection and/or contacting a real estate professional.
Based on information from California Regional Multiple Listing Service, Inc. and /or other sources. All data, including all measurements and calculations of area, is obtained from various sources and has not been, and will not be, verified by broker or MLS. All information should be independently reviewed and verified for accuracy. Properties may or may not be listed by the office/agent presenting the information