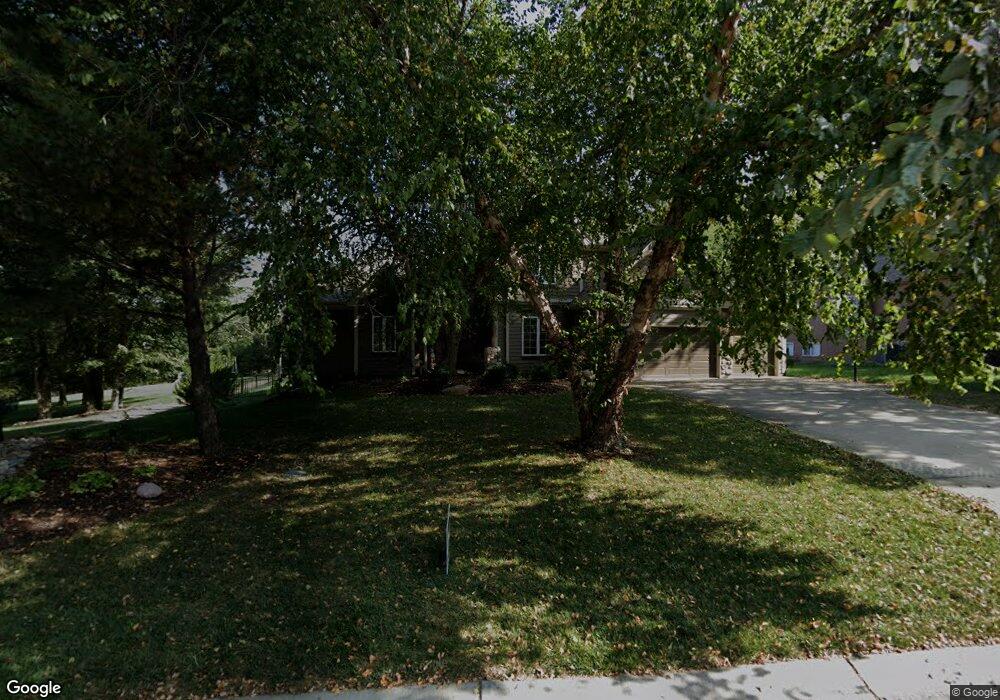
2616 NW Ashurst Ln Lees Summit, MO 64081
Estimated Value: $522,341 - $686,000
3
Beds
4
Baths
2,488
Sq Ft
$246/Sq Ft
Est. Value
About This Home
This home is located at 2616 NW Ashurst Ln, Lees Summit, MO 64081 and is currently estimated at $612,085, approximately $246 per square foot. 2616 NW Ashurst Ln is a home located in Jackson County with nearby schools including Cedar Creek Elementary School, Pleasant Lea Middle School, and Lee's Summit Senior High School.
Ownership History
Date
Name
Owned For
Owner Type
Purchase Details
Closed on
Oct 21, 2011
Sold by
Burnett David M and Burnett Jane A
Bought by
Burnett Jane A
Current Estimated Value
Purchase Details
Closed on
Apr 20, 2004
Sold by
Burnett David M and Burnett Jane A
Bought by
Burnett David M and Burnett Jane A
Purchase Details
Closed on
Oct 5, 2000
Sold by
Pfeifer King Building Corp
Bought by
Burnett Dave and Burnett Jane
Home Financials for this Owner
Home Financials are based on the most recent Mortgage that was taken out on this home.
Original Mortgage
$250,000
Outstanding Balance
$91,628
Interest Rate
7.99%
Mortgage Type
Purchase Money Mortgage
Estimated Equity
$520,457
Purchase Details
Closed on
Apr 28, 2000
Sold by
Ruff Lands Llc
Bought by
Pfeifer King Building Corp
Home Financials for this Owner
Home Financials are based on the most recent Mortgage that was taken out on this home.
Original Mortgage
$245,000
Interest Rate
8.19%
Mortgage Type
Construction
Create a Home Valuation Report for This Property
The Home Valuation Report is an in-depth analysis detailing your home's value as well as a comparison with similar homes in the area
Home Values in the Area
Average Home Value in this Area
Purchase History
| Date | Buyer | Sale Price | Title Company |
|---|---|---|---|
| Burnett Jane A | -- | Secured Title Of Kansas City | |
| Burnett David M | -- | -- | |
| Burnett Dave | -- | Security Land Title Company | |
| Pfeifer King Building Corp | -- | Security Land Title Company | |
| Ruf Lands Llc | -- | Security Land Title Co |
Source: Public Records
Mortgage History
| Date | Status | Borrower | Loan Amount |
|---|---|---|---|
| Open | Burnett Dave | $250,000 | |
| Previous Owner | Pfeifer King Building Corp | $245,000 |
Source: Public Records
Tax History Compared to Growth
Tax History
| Year | Tax Paid | Tax Assessment Tax Assessment Total Assessment is a certain percentage of the fair market value that is determined by local assessors to be the total taxable value of land and additions on the property. | Land | Improvement |
|---|---|---|---|---|
| 2025 | $6,050 | $96,349 | $19,515 | $76,834 |
| 2024 | $6,006 | $83,782 | $11,204 | $72,578 |
| 2023 | $6,006 | $83,783 | $11,026 | $72,757 |
| 2022 | $6,488 | $80,370 | $13,015 | $67,355 |
| 2021 | $6,622 | $80,370 | $13,015 | $67,355 |
| 2020 | $6,373 | $76,592 | $13,015 | $63,577 |
| 2019 | $6,199 | $76,592 | $13,015 | $63,577 |
| 2018 | $6,353 | $72,847 | $9,943 | $62,904 |
| 2017 | $6,353 | $72,847 | $9,943 | $62,904 |
| 2016 | $6,258 | $71,022 | $12,445 | $58,577 |
| 2014 | $6,518 | $72,513 | $10,520 | $61,993 |
Source: Public Records
Map
Nearby Homes
- 2503 NW Windwood Dr
- 2501 NW Shady Bend Ln
- 2536 NW Bent Tree Cir
- 2508 NW Bent Tree Cir
- 2436 NW Valley View Dr
- 130 NW Ambersham Dr
- 813 NW High Point Dr
- 505 NW Ambersham Dr
- 320 NW Lovins
- 321 NW Lovins
- 317 NW Lovins
- 316 NW Lovins
- 2257 NW Summerfield Dr
- Manitoba Plan at Winterset Falls
- Stratoga II Plan at Winterset Falls
- Lockwood Plan at Winterset Falls
- Chianti Side Entry Plan at Winterset Falls
- Sullivan II Plan at Winterset Falls
- Cortona Plan at Winterset Falls
- Solaia Plan at Winterset Falls
- 2620 NW Ashurst Ln
- 2608 NW Ashurst Ln
- 2624 NW Ashurst Ln
- 2617 NW Ashurst Ln
- 2613 NW Ashurst Ln
- 2628 NW Ashurst Ln
- 596 NW Riven Rock Trail
- 2621 NW Ashurst Ln
- 592 NW Riven Rock Trail
- 2609 NW Ashurst Ln
- 2632 NW Ashurst Ln
- 604 NW Riven Rock Trail
- 2625 NW Ashurst Ln
- 2605 NW Ashurst Ln
- 2636 NW Ashurst Ln
- 2629 NW Ashurst Ln
- 605 NW Riven Rock Trail
- 2725 NW Chipman Rd
- 597 NW Riven Rock Trail
- 609 NW Riven Rock Trail