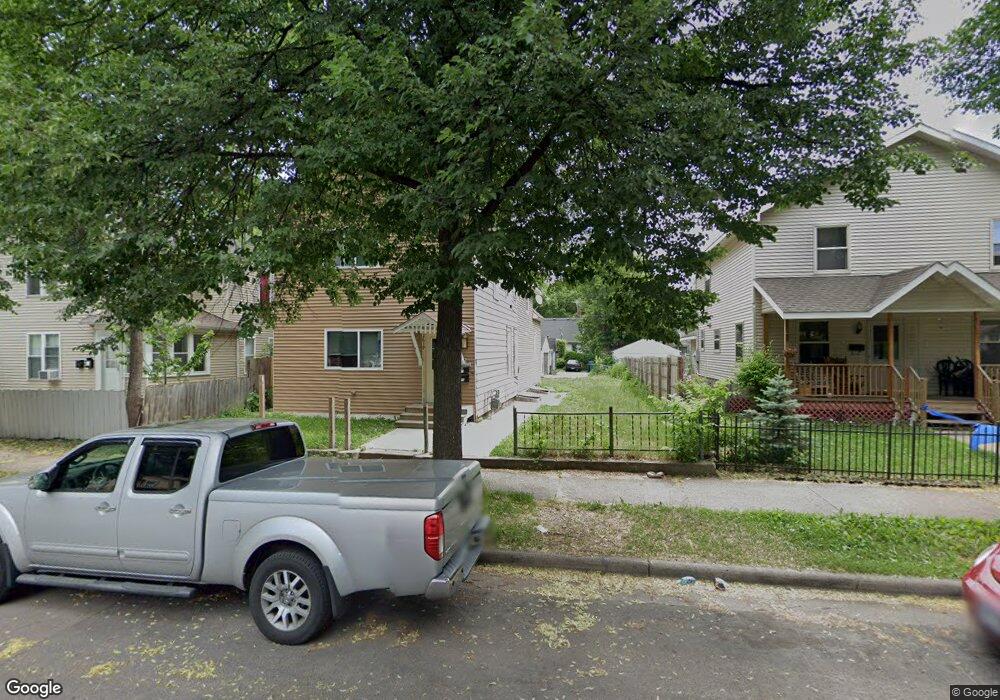
2617 13th Ave S Minneapolis, MN 55407
Phillips NeighborhoodEstimated Value: $286,000 - $336,000
4
Beds
4
Baths
1,789
Sq Ft
$174/Sq Ft
Est. Value
About This Home
This home is located at 2617 13th Ave S, Minneapolis, MN 55407 and is currently estimated at $311,057, approximately $173 per square foot. 2617 13th Ave S is a home located in Hennepin County with nearby schools including Andersen United Middle School, South Senior High School, and Lirio Montessori.
Ownership History
Date
Name
Owned For
Owner Type
Purchase Details
Closed on
Jul 19, 2010
Sold by
Wells Fargo Bank Na
Bought by
Ojeda Romel
Current Estimated Value
Purchase Details
Closed on
May 4, 2006
Sold by
Berson Ludmilla and Berson Mark
Bought by
Vorotinov Irina and Vorotinov Igor
Purchase Details
Closed on
Mar 9, 2005
Sold by
Ortiz Fausto G and Valez Ortiz Claudia
Bought by
Berson Ludmilla
Purchase Details
Closed on
Nov 17, 2003
Sold by
Kruchten Joseph P and Kruchten Sonia L
Bought by
Ortiz Fausto G and Ortiz Valez V Claudia
Purchase Details
Closed on
Dec 31, 2001
Sold by
Gerold Vivian M
Bought by
Kruchten Joseph P
Purchase Details
Closed on
Dec 5, 1998
Sold by
Kruchten Joseph P
Bought by
Ortiz Raul and Ortiz Fausto G
Purchase Details
Closed on
Nov 6, 1997
Sold by
Gerold Vivian M
Bought by
Kruchten Joseph P
Purchase Details
Closed on
Sep 15, 1994
Sold by
Vi Gerold C E
Bought by
Kerkula Edwin G
Create a Home Valuation Report for This Property
The Home Valuation Report is an in-depth analysis detailing your home's value as well as a comparison with similar homes in the area
Home Values in the Area
Average Home Value in this Area
Purchase History
| Date | Buyer | Sale Price | Title Company |
|---|---|---|---|
| Ojeda Romel | $41,300 | -- | |
| Vorotinov Irina | $264,900 | -- | |
| Berson Ludmilla | $249,900 | -- | |
| Ortiz Fausto G | $50,000 | -- | |
| Kruchten Joseph P | $25,000 | -- | |
| Ortiz Raul | $50,000 | -- | |
| Kruchten Joseph P | $25,000 | -- | |
| Kerkula Edwin G | $36,000 | -- |
Source: Public Records
Mortgage History
| Date | Status | Borrower | Loan Amount |
|---|---|---|---|
| Closed | Kerkula Edwin G | -- |
Source: Public Records
Tax History Compared to Growth
Tax History
| Year | Tax Paid | Tax Assessment Tax Assessment Total Assessment is a certain percentage of the fair market value that is determined by local assessors to be the total taxable value of land and additions on the property. | Land | Improvement |
|---|---|---|---|---|
| 2024 | $5,277 | $276,000 | $52,000 | $224,000 |
| 2023 | $4,891 | $290,000 | $47,000 | $243,000 |
| 2022 | $4,772 | $262,000 | $37,000 | $225,000 |
| 2021 | $4,828 | $265,000 | $25,000 | $240,000 |
| 2020 | $4,136 | $278,500 | $26,400 | $252,100 |
| 2019 | $3,603 | $234,000 | $17,600 | $216,400 |
| 2018 | $3,063 | $198,500 | $17,600 | $180,900 |
| 2017 | $2,943 | $157,000 | $16,000 | $141,000 |
| 2016 | $3,017 | $142,500 | $16,000 | $126,500 |
| 2015 | $2,516 | $124,000 | $16,000 | $108,000 |
| 2014 | -- | $112,500 | $16,000 | $96,500 |
Source: Public Records
Map
Nearby Homes
- 2628 14th Ave S
- 2630 14th Ave S
- 2535 11th Ave S
- 2711 14th Ave S
- 2442 15th Ave S
- 2543 10th Ave S
- 2417 15th Ave S
- 2534 17th Ave S
- 2428 11th Ave S
- 2720 16th Ave S
- 2724 16th Ave S
- 2402 16th Ave S
- 2705 17th Ave S
- 1318 E 23rd St
- 2909 13th Ave S
- 1106 E 22nd St
- 2221 Elliot Ave
- 2615 Park Ave Unit 311
- 2615 Park Ave Unit 309
- 2615 Park Ave Unit B1
- 2613 13th Ave S
- 2623 13th Ave S
- 2611 13th Ave S Unit 2611
- 2609 13th Ave S
- 2627 13th Ave S
- 2607 13th Ave S
- 2605 13th Ave S
- 2605 2605 13th-Avenue-s
- 2631 13th Ave S
- 2601 2601 13th-Avenue-s
- 2601 13th Ave S
- 2618 13th Ave S
- 2620 13th Ave S
- 2616 14th Ave S
- 2610 13th Ave S
- 2612 14th Ave S
- 2620 14th Ave S
- 2626 2626 13th-Avenue-s
- 2626 2626 13th Ave
- 2633 13th Ave S